Assume that the following data represent baseball batting averages for a random sample of National League players near the end of the baseball season. Multiply each data value by 1000 to "clear" the decimals. Baseball Batting Averages 0.195 0.257 0.150 0.291 0.157 0.295 0.260 0.250 0.182 0.124 0.106 0.259 0.309 0.309 0.277 0.287 0.316 0.252 0.216 0.250 0.248 0.259 0.269 0.183 0.113 0.204 O 195 124 216 O 195 124 216 O O 195 257 150 106 250 216 2570 257 291 106 259 309 250 248 259 150 257 291 106 259 309 250 248 259 Ⓒ195 124 291 259 309 248 259 195 2570 150 124 106 259 216 250 248 291 309 259 157 309 269 2570 1500 291 106 259 309 157 309 269 157 309 269 309 269 295 277 113 309 295 287 183 295 277 183 Baseball Batting Averages 295 260 2770 2870 1830 113 260 287 183 295 2770 260 277 113 260 287 113 260 2870 2500 316 204 182 316 204 250 316 204 250 316 204 182 252 250 252 182 252 182 252 2500 182 316 252 267
Assume that the following data represent baseball batting averages for a random sample of National League players near the end of the baseball season. Multiply each data value by 1000 to "clear" the decimals. Baseball Batting Averages 0.195 0.257 0.150 0.291 0.157 0.295 0.260 0.250 0.182 0.124 0.106 0.259 0.309 0.309 0.277 0.287 0.316 0.252 0.216 0.250 0.248 0.259 0.269 0.183 0.113 0.204 O 195 124 216 O 195 124 216 O O 195 257 150 106 250 216 2570 257 291 106 259 309 250 248 259 150 257 291 106 259 309 250 248 259 Ⓒ195 124 291 259 309 248 259 195 2570 150 124 106 259 216 250 248 291 309 259 157 309 269 2570 1500 291 106 259 309 157 309 269 157 309 269 309 269 295 277 113 309 295 287 183 295 277 183 Baseball Batting Averages 295 260 2770 2870 1830 113 260 287 183 295 2770 260 277 113 260 287 113 260 2870 2500 316 204 182 316 204 250 316 204 250 316 204 182 252 250 252 182 252 182 252 2500 182 316 252 267

Glencoe Algebra 1, Student Edition, 9780079039897, 0079039898, 2018
18th Edition
ISBN:9780079039897
Author:Carter
Publisher:Carter
Chapter10: Statistics
Section10.5: Comparing Sets Of Data
Problem 3CYU

Related questions
Question
Please answer this question, show work!
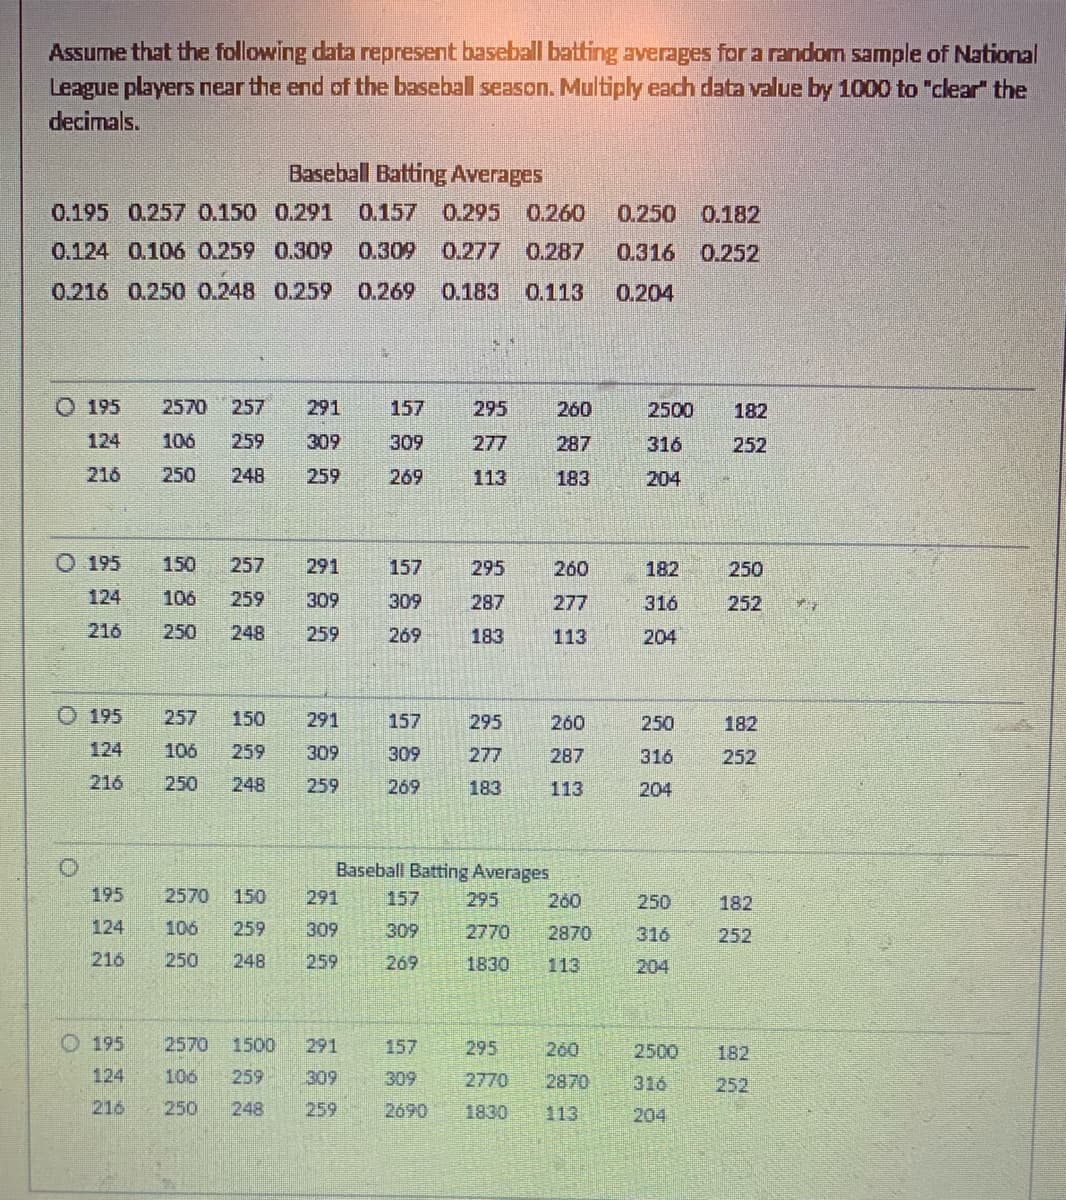
Transcribed Image Text:Assume that the following data represent baseball batting averages for a random sample of National
League players near the end of the baseball season. Multiply each data value by 1000 to "clear" the
decimals.
Baseball Batting Averages
0.195 0.257 0.150 0.291 0.157 0.295 0.260 0.250 0.182
0.124 0.106 0.259 0.309 0.309 0.277 0.287 0.316 0.252
0.216 0.250 0.248 0.259 0.269 0.183 0.113 0.204
O 195
124
216
O 195
124
216
Ⓒ195
0
2570 257 291
106 259 309
250 248
259
150 257 291
106 259 309
250
248
259
257 150
124 106
216
250
291
259 309
248
259
195
124
216 250
195 2570 150 291
124
106 259 309
216
250
248 259
2570 1500 291
106 259
309
248
259
157
309
269
157 295
309
287
269
183
157
309
269
295
277
113
309
269
157
309
2690
295
277
183
Baseball Batting Averages
295
2770
1830 113
260
287
183
295
2770
1830
260
277
113
260
287
113
260
2870
260
28.70
2500
316
204
182
316
204
250
316
204
250
316
204
2500
316
182
252
250
252
182
252
182
252
182
252
257
Expert Solution
This question has been solved!
Explore an expertly crafted, step-by-step solution for a thorough understanding of key concepts.

Step by step
Solved in 3 steps with 3 images

Recommended textbooks for you
Glencoe Algebra 1, Student Edition, 9780079039897…
Algebra
ISBN:
9780079039897
Author:
Carter
Publisher:
McGraw Hill
Glencoe Algebra 1, Student Edition, 9780079039897…
Algebra
ISBN:
9780079039897
Author:
Carter
Publisher:
McGraw Hill