What is the appropriate statistical test to identify any significant difference between Gender groups and patients’ Albumin Levels? Write down the assumptions of the proposed statistical test? Formulate null hypothesis & alternative hypothesis for such an association?
What is the appropriate statistical test to identify any significant difference between Gender groups and patients’ Albumin Levels? Write down the assumptions of the proposed statistical test? Formulate null hypothesis & alternative hypothesis for such an association?

MATLAB: An Introduction with Applications
6th Edition
ISBN:9781119256830
Author:Amos Gilat
Publisher:Amos Gilat
Chapter1: Starting With Matlab
Section: Chapter Questions
Problem 1P

Related questions
Question
What is the appropriate statistical test to identify any significant difference between Gender groups and patients’ Albumin Levels? Write down the assumptions of the proposed statistical test? Formulate null hypothesis & alternative hypothesis for such an association?
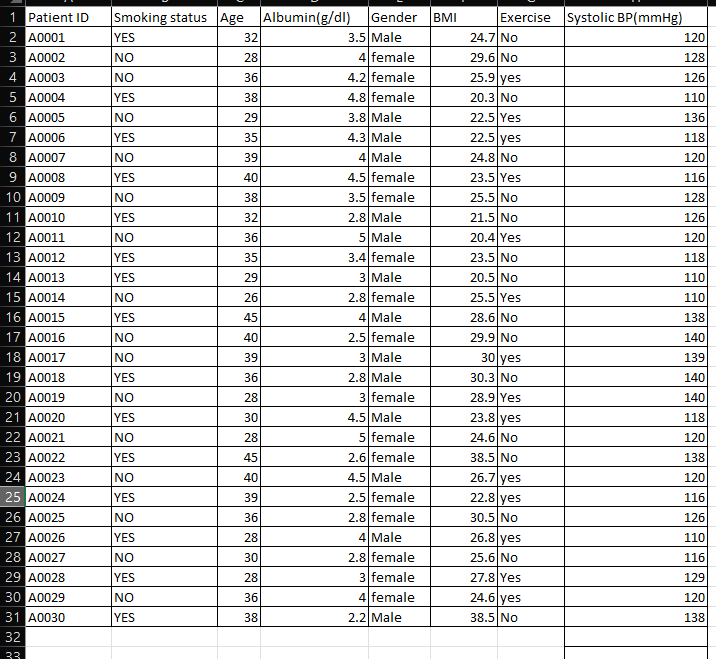
Transcribed Image Text:1 Patient ID
2 A0001
3 A0002
4 A0003
5 A0004
6 A0005
7 A0006
8 A0007
9 A0008
10 A0009
11 A0010
12 A0011
13 A0012
14 A0013
15 A0014
16 A0015
17 A0016
18 A0017
19 A0018
20 A0019
21 A0020
22 A0021
23 A0022
24 A0023
25 A0024
26 A0025
27 A0026
28 A0027
29 A0028
30 A0029
31 A0030
32
33
Smoking status Age Albumin(g/dl)
YES
NO
NO
YES
NO
YES
NO
YES
NO
YES
NO
YES
YES
NO
YES
INO
NO
YES
NO
YES
NO
YES
NO
YES
NO
YES
NO
YES
INO
YES
32
28
36
38
29
35
39
40
38
32
36
2888EEEE8
35
29
26
45
40
39
36
30
2
28
45
40
39
36
28
30
28
36
38
Gender BMI
3.5 Male
4 female
4.2 female
4.8 female
3.8 Male
4.3 Male
4 Male
4.5 female
3.5 female
2.8 Male
5 Male
3.4 female
3 Male
2.8 female
4 Male
2.5 female
3 Male
2.8 Male
3 female
4.5 Male
5 female
2.6 female
4.5 Male
2.5 female
2.8 female
4 Male
2.8 female
3 female
4 female
2.2 Male
Exercise Systolic BP (mmHg)
24.7 No
29.6 No
25.9 yes
20.3 No
22.5 Yes
22.5 yes
24.8 No
23.5 Yes
25.5 No
21.5 No
20.4 Yes
23.5 No
20.5 No
25.5 Yes
28.6 No
29.9 No
30 yes
30.3 No
28.9 Yes
23.8 yes
24.6 No
38.5 No
26.7 yes
22.8 yes
30.5 No
26.8 yes
25.6 No
27.8 Yes
24.6 yes
38.5 No
120
128
126
110
136
118
120
116
128
126
120
118
110
110
138
140
139
140
140
118
120
138
120
116
126
110
116
129
120
138
Expert Solution
This question has been solved!
Explore an expertly crafted, step-by-step solution for a thorough understanding of key concepts.

Step by step
Solved in 3 steps

Recommended textbooks for you
MATLAB: An Introduction with Applications
Statistics
ISBN:
9781119256830
Author:
Amos Gilat
Publisher:
John Wiley & Sons Inc

Probability and Statistics for Engineering and th…
Statistics
ISBN:
9781305251809
Author:
Jay L. Devore
Publisher:
Cengage Learning

Statistics for The Behavioral Sciences (MindTap C…
Statistics
ISBN:
9781305504912
Author:
Frederick J Gravetter, Larry B. Wallnau
Publisher:
Cengage Learning
MATLAB: An Introduction with Applications
Statistics
ISBN:
9781119256830
Author:
Amos Gilat
Publisher:
John Wiley & Sons Inc
Probability and Statistics for Engineering and th…
Statistics
ISBN:
9781305251809
Author:
Jay L. Devore
Publisher:
Cengage Learning
Statistics for The Behavioral Sciences (MindTap C…
Statistics
ISBN:
9781305504912
Author:
Frederick J Gravetter, Larry B. Wallnau
Publisher:
Cengage Learning

Elementary Statistics: Picturing the World (7th E…
Statistics
ISBN:
9780134683416
Author:
Ron Larson, Betsy Farber
Publisher:
PEARSON

The Basic Practice of Statistics
Statistics
ISBN:
9781319042578
Author:
David S. Moore, William I. Notz, Michael A. Fligner
Publisher:
W. H. Freeman

Introduction to the Practice of Statistics
Statistics
ISBN:
9781319013387
Author:
David S. Moore, George P. McCabe, Bruce A. Craig
Publisher:
W. H. Freeman