Assume that the readings on the thermometers are normally distributed with a mean of 0 degree and standard deviation of 1.00 degree*C. A thermometer is randomly selected and tested . Draw a sketch and find the temperature reading corresponding to P 82 the P82nd percentile . This is the temperature reading separating the bottom 82 % from the top 18%.
Assume that the readings on the thermometers are normally distributed with a mean of 0 degree and standard deviation of 1.00 degree*C. A thermometer is randomly selected and tested . Draw a sketch and find the temperature reading corresponding to P 82 the P82nd percentile . This is the temperature reading separating the bottom 82 % from the top 18%.

Glencoe Algebra 1, Student Edition, 9780079039897, 0079039898, 2018
18th Edition
ISBN:9780079039897
Author:Carter
Publisher:Carter
Chapter10: Statistics
Section10.2: Representing Data
Problem 12PPS

Related questions
Question
Assume that the readings on the thermometers are
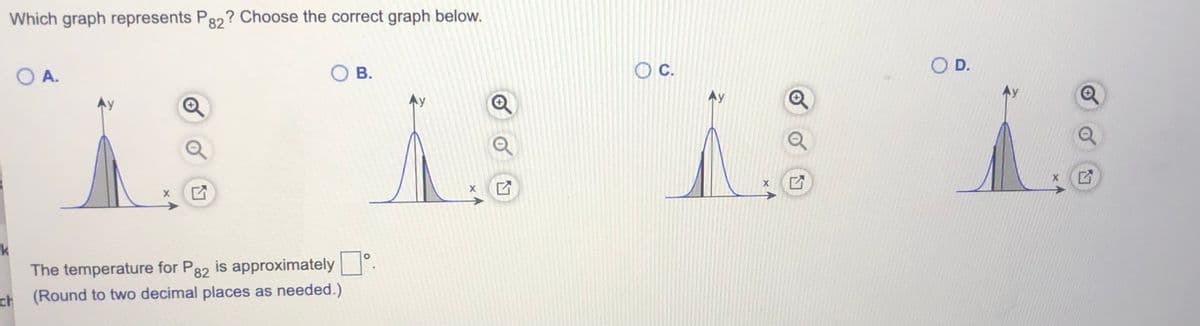
Transcribed Image Text:Which graph represents Pg2? Choose the correct graph below.
O B.
OC.
O D.
A.
Ay
Ay
k
The temperature for P82 is approximately
(Round to two decimal places as needed.)
Expert Solution
This question has been solved!
Explore an expertly crafted, step-by-step solution for a thorough understanding of key concepts.

This is a popular solution!

Trending now
This is a popular solution!

Step by step
Solved in 2 steps with 2 images

Recommended textbooks for you
Glencoe Algebra 1, Student Edition, 9780079039897…
Algebra
ISBN:
9780079039897
Author:
Carter
Publisher:
McGraw Hill

College Algebra (MindTap Course List)
Algebra
ISBN:
9781305652231
Author:
R. David Gustafson, Jeff Hughes
Publisher:
Cengage Learning
Glencoe Algebra 1, Student Edition, 9780079039897…
Algebra
ISBN:
9780079039897
Author:
Carter
Publisher:
McGraw Hill
College Algebra (MindTap Course List)
Algebra
ISBN:
9781305652231
Author:
R. David Gustafson, Jeff Hughes
Publisher:
Cengage Learning