Assume that the relationship between the calories in a five-ounce serving and the % alcohol content for a sample of wines is linear. Use the % alcohol as the explanatory variable, and fit a least squares regression line. b. Report the equation of the regression line and interpret it in the context of the problem. Mean Std. Dev. r Data table (Source:healthalicious.com) Calories % alcohol 10.6 10.1 10.1 122 119 121 123 129 236 8.8 11.1 15.2 Table of summary statistics Calories 141.67 46.34 0.95 % alcohol 11.03 2.32
Assume that the relationship between the calories in a five-ounce serving and the % alcohol content for a sample of wines is linear. Use the % alcohol as the explanatory variable, and fit a least squares regression line. b. Report the equation of the regression line and interpret it in the context of the problem. Mean Std. Dev. r Data table (Source:healthalicious.com) Calories % alcohol 10.6 10.1 10.1 122 119 121 123 129 236 8.8 11.1 15.2 Table of summary statistics Calories 141.67 46.34 0.95 % alcohol 11.03 2.32

Functions and Change: A Modeling Approach to College Algebra (MindTap Course List)
6th Edition
ISBN:9781337111348
Author:Bruce Crauder, Benny Evans, Alan Noell
Publisher:Bruce Crauder, Benny Evans, Alan Noell
Chapter3: Straight Lines And Linear Functions
Section3.CR: Chapter Review Exercises
Problem 15CR: Life Expectancy The following table shows the average life expectancy, in years, of a child born in...

Related questions
Question
Report the equation of the regression line and interpret it in the context of the problem
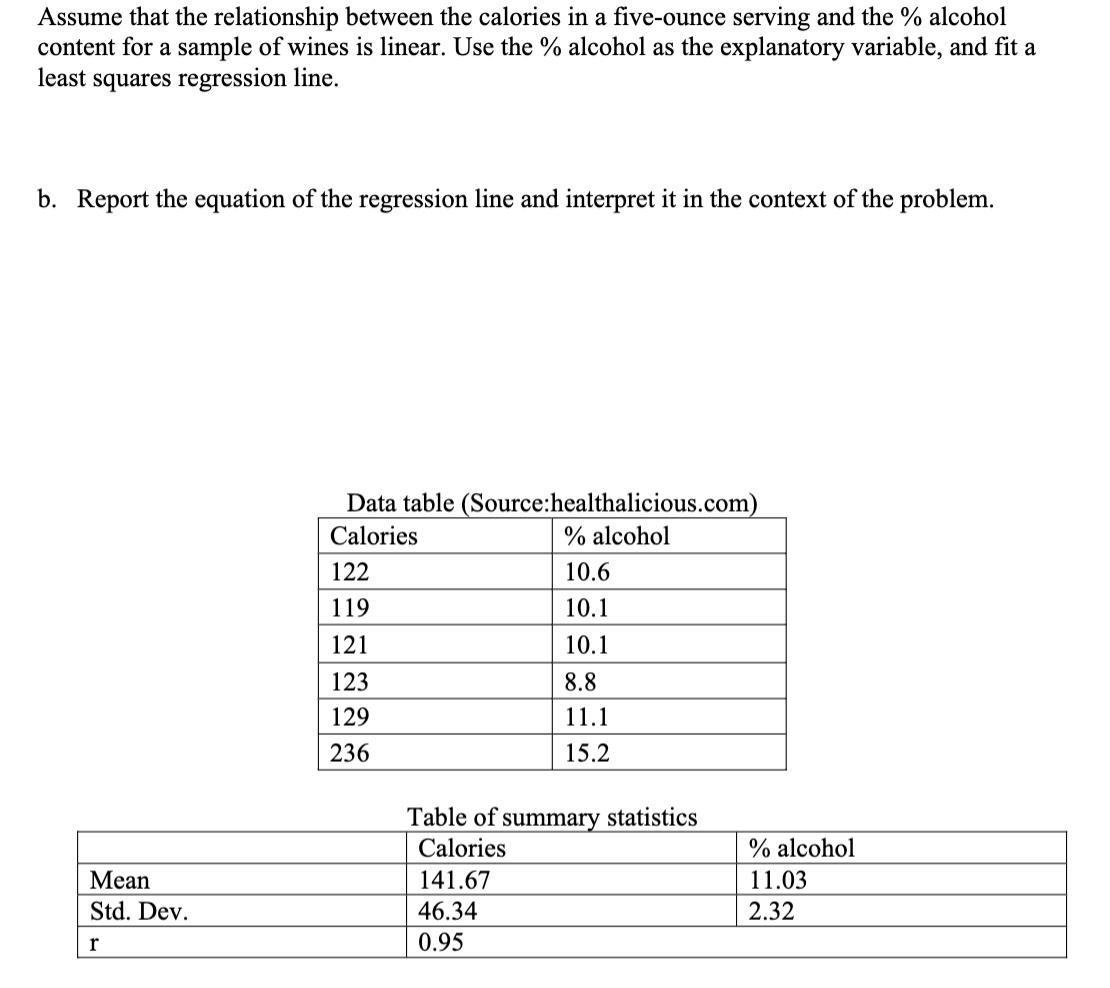
Transcribed Image Text:Assume that the relationship between the calories in a five-ounce serving and the % alcohol
content for a sample of wines is linear. Use the % alcohol as the explanatory variable, and fit a
least squares regression line.
b. Report the equation of the regression line and interpret it in the context of the problem.
Mean
Std. Dev.
r
Data table (Source:healthalicious.com)
Calories
% alcohol
10.6
10.1
10.1
8.8
11.1
15.2
122
119
121
123
129
236
Table of summary statistics
Calories
141.67
46.34
0.95
% alcohol
11.03
2.32
Expert Solution
This question has been solved!
Explore an expertly crafted, step-by-step solution for a thorough understanding of key concepts.

This is a popular solution!

Trending now
This is a popular solution!

Step by step
Solved in 4 steps with 5 images

Recommended textbooks for you
Functions and Change: A Modeling Approach to Coll…
Algebra
ISBN:
9781337111348
Author:
Bruce Crauder, Benny Evans, Alan Noell
Publisher:
Cengage Learning

Glencoe Algebra 1, Student Edition, 9780079039897…
Algebra
ISBN:
9780079039897
Author:
Carter
Publisher:
McGraw Hill

Functions and Change: A Modeling Approach to Coll…
Algebra
ISBN:
9781337111348
Author:
Bruce Crauder, Benny Evans, Alan Noell
Publisher:
Cengage Learning
Glencoe Algebra 1, Student Edition, 9780079039897…
Algebra
ISBN:
9780079039897
Author:
Carter
Publisher:
McGraw Hill

Algebra and Trigonometry (MindTap Course List)
Algebra
ISBN:
9781305071742
Author:
James Stewart, Lothar Redlin, Saleem Watson
Publisher:
Cengage Learning

Big Ideas Math A Bridge To Success Algebra 1: Stu…
Algebra
ISBN:
9781680331141
Author:
HOUGHTON MIFFLIN HARCOURT
Publisher:
Houghton Mifflin Harcourt