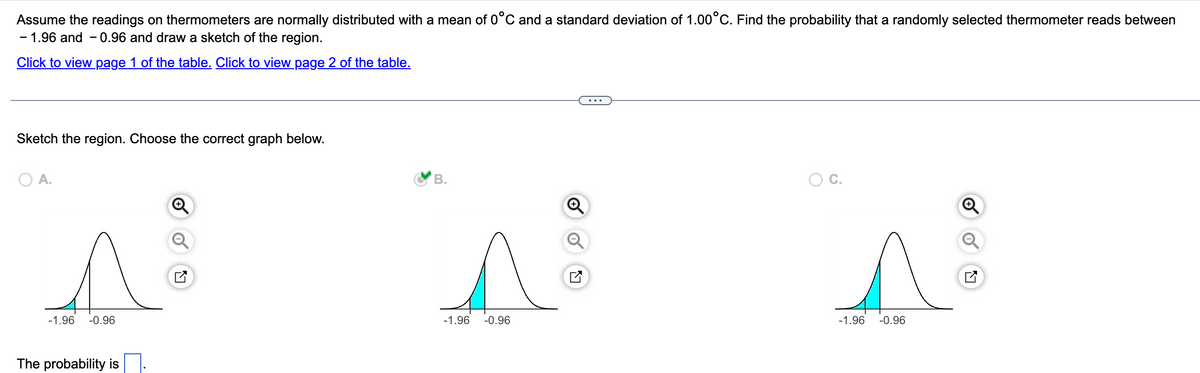
Assume the readings on thermometers are normally distributed with a mean of 0°C and a standard deviation of 1.00°C. Find the probability that a randomly selected thermometer reads between -1.96 and -0.96 and draw a sketch of the region. Click to view page 1 of the table. Click to view page 2 of the table. Sketch the region. Choose the correct graph below. O A. A -1.96 -0.96 The probability is. B. s -1.96 -0.96 O C. -1.96 -0.96
Assume the readings on thermometers are normally distributed with a mean of 0°C and a standard deviation of 1.00°C. Find the probability that a randomly selected thermometer reads between -1.96 and -0.96 and draw a sketch of the region. Click to view page 1 of the table. Click to view page 2 of the table. Sketch the region. Choose the correct graph below. O A. A -1.96 -0.96 The probability is. B. s -1.96 -0.96 O C. -1.96 -0.96

Glencoe Algebra 1, Student Edition, 9780079039897, 0079039898, 2018
18th Edition
ISBN:9780079039897
Author:Carter
Publisher:Carter
Chapter10: Statistics
Section10.4: Distributions Of Data
Problem 22PFA

Related questions
Question
Transcribed Image Text:Assume the readings on thermometers are normally distributed with a mean of 0°C and a standard deviation of 1.00°C. Find the probability that a randomly selected thermometer reads between
- 1.96 and 0.96 and draw a sketch of the region.
Click to view page 1 of the table. Click to view page 2 of the table.
Sketch the region. Choose the correct graph below.
A.
s
-1.96 -0.96
The probability is
U
B.
^
-0.96
-1.96
C.
^
-1.96
-0.96
N
Expert Solution
This question has been solved!
Explore an expertly crafted, step-by-step solution for a thorough understanding of key concepts.

This is a popular solution!

Trending now
This is a popular solution!

Step by step
Solved in 2 steps

Recommended textbooks for you
Glencoe Algebra 1, Student Edition, 9780079039897…
Algebra
ISBN:
9780079039897
Author:
Carter
Publisher:
McGraw Hill

Big Ideas Math A Bridge To Success Algebra 1: Stu…
Algebra
ISBN:
9781680331141
Author:
HOUGHTON MIFFLIN HARCOURT
Publisher:
Houghton Mifflin Harcourt
Glencoe Algebra 1, Student Edition, 9780079039897…
Algebra
ISBN:
9780079039897
Author:
Carter
Publisher:
McGraw Hill
Big Ideas Math A Bridge To Success Algebra 1: Stu…
Algebra
ISBN:
9781680331141
Author:
HOUGHTON MIFFLIN HARCOURT
Publisher:
Houghton Mifflin Harcourt