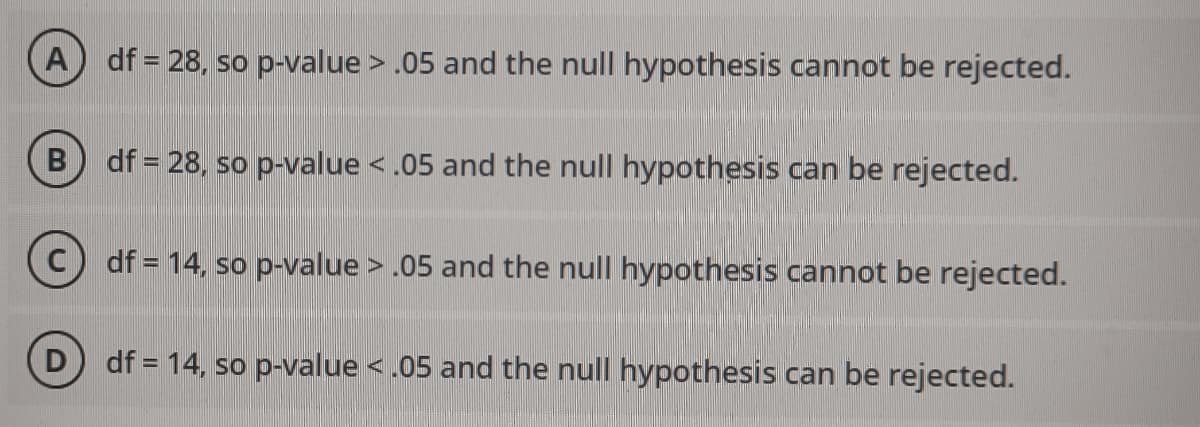
Assuming the conditions are met, based on the t-statistic of 1.80 the appropriate conclusion for this test using α = .05 is: (Check the t-table) Choices in picture


Q: Example 10.1 A group of 10 students are to be divided into 2 groups of 5 each and seated at two…
A:
Q: A random sample of college student ages is given below. Assume the population of college students…
A:
Q: Suppose you run research about the relationship between the frequency of smoking and hours of sleep.…
A: Given: r=-0.63
Q: Suppose you want to compute the correlation between overspending behavior and gaming aggression. You…
A: Given Information: Given Variables=1. Overdpending behavior2. Gaming Aggression.r=-5.36
Q: A test is conducted for Ho: μ = 20, with o = 4. A sample of size 36 has X = 21.4. The test statistic…
A:
Q: 7.24).
A: * SOLUTION :- From the given information the answer is provided as below
Q: . Which of the variables is quantitative? a. the name of the division holding the meeting b.…
A: Quantitative variable: The variable which can take numerical values is called quantitative variable.
Q: One-Sample Statistics N Mean 8 Std. Deviation Std. Error Mean 10.74377 3.79850 One-Sample Test…
A:
Q: Treatment I 3 10 7 8 Treatment II 3 4 7 A G
A: Treatment I Treatment II 3 3 10 4 7 7 8 4 10 10 12 2 13 5 12 6
Q: A binomial experiment has the given number of trials n and the given success probability p. n=16…
A:
Q: It is tested by a statistical test. a. Null hypothesis b. Alternative hypothesis c. Test statistic…
A: Given that
Q: Which statement below is true? It is possible for a distribution of scores to have two means. It is…
A: Mean: Mean is the expected value of a set of observations. In other words, mean is he average of the…
Q: Angela and Carissa began arguing about who did better on their tests, but they couldn't decide who…
A:
Q: 7 How do i derive the quadratic and cubic functions from the point group
A: Given information: Quadratic function from the point group. Note: - As per guidelines we will solve…
Q: Which of the following is not one of the assumptions of the t-test for independent samples? The…
A: Given that Based on the given data
Q: Boys and girls: The National Health Statistics Reports reported that a sample of 310 one-year-old…
A: Given X1-bar=25.3 X2-bar=24.3 n1=310 n2=286
Q: A house cleaning service claims that it can clean a four-bedroom house in less than 2 hours. A…
A:
Q: Question In the PRF represented in the equation (1), assume the error term u¡ ~ i.i.d N(0,♂²), prove…
A:
Q: 1. Consider the following cumulative frequency distribution. Class Limits 0 - under 5 5 - under 10…
A: Frequency of a class= Cumulative frequency of the class - Cumulative frequency of previous class.
Q: You generate a scatter plot using Excel. You then have Excel plot the trend line and report the…
A: The coefficient of determination is the percentage of variation in y explained by the variable x.…
Q: The target thickness of aluminum sheets produced by a machine is 5 mm. A sample of 50 sheets is…
A: Given: Sample size, n=50Sample mean, x¯=0.46Sample sd, s=0.36α=0.05
Q: Suppose we have the following data collected from three randomly-selected counties 1.How many…
A: Given: Sample size n = 3 Formula Used: Degree of freedom = n-2 Correlation coefficient r =…
Q: A company warranties its laptop computers. Every defective laptop costs the company $200 in repair…
A:
Q: 1.The test scores of Biostatistics examination follows a normal distribution with a mean of 60 and a…
A: As per bartleby guideline expert have to answer first question only dear student please upload other…
Q: Business process improvement - Statistical Process Control (3) While conducting process capability…
A:
Q: average marks obta follows Section Average marks No. of students Find combined mean. by the students…
A:
Q: A fair coin is tossed n times. The histogram for the resulting binomial distribution is labelled 0,…
A: Considering the tossed coin is fair, and assuming a specified face, the Psuccess=Pfailure=0.5. For…
Q: A student was asked to find a 99% confidence interval for the proportion of students who take notes…
A: Solution-: Given n=89. and 99% C.I. for population proportion p is, 0.12<p<0.34
Q: Professor Doja Cat conducted an experiment with 24 participants who are asked to respond to one of…
A: Given that Professor Doja Cat conducted an experiment with 24 participants who are asked to respond…
Q: During a barangay census, the following information was acquired. 15 children out of 23 are…
A: Given that During a barangay census, the following information was acquired. 15 children out of…
Q: Lesson: Poisson Distribution 1. The marketing manager of a company has noted that she usually…
A:
Q: What is the probability of drawing a Clubs or King from a 52 deck card deck? b.) Two cards are…
A: From the provided information, Total cards in standard deck = 52 Total Kings = 4 Total clubs = 13
Q: A personal computer is used for office work at home, research, communication, personal finances,…
A:
Q: I generated samples of (y,x) and fit simple linear regression models: (i) y on x, are the (partial)…
A: As we see that, p-value is same for coefficient y and x. So t-value will also be the same for both…
Q: A magazine provided results from a poll of 500 adults who were asked to identify their favorite pie.…
A: It is given that: p^ (proportion of adults, who lie chocolate pie at the sample level)=11% (i..e,…
Q: If X and Y are two random variables, then the covariance of x+a,Y +b,where a and b are constant is…
A:
Q: A set of data has a normal distribution with a mean of 100 and a standard deviation of 15. Find the…
A:
Q: he accompanying data table lists the magnitudes of 50 earthquakes measured on the Richter scale.…
A: Solution: Given information: n= 50 Sample size x =∑xn=59.2150=1.1842 Sample mean s= ∑(x-x)2n-1s=…
Q: Suppose we examined medical records of 500 individuals admitted to the hospital, and we…
A: Given that, medical records of 500 individuals admitted to the hospital were examined, and…
Q: Y₁ =B₁ + B₁X₁ + e, (2) In which , and B, are OLS estimates of b, and b₁, respectively. n Σx, Yi (1)…
A: We have given that
Q: 11. There are 500 students in ABC school. 150 students are enrolled in an Algebra course and 80…
A:
Q: 3.2 Solve the below problem: A learning experiment requires a rat to run a maze (a network of…
A: In the given case, the rat is assumed to select the exit randomly out of the available three. Let us…
Q: A pharmaceutical company claims that a medicine will produce a desired effect for a mean time of…
A:
Q: A randomly sampled group of patients at a major U.S. regional hospital became part of a nutrition…
A: According to our policy we can answer only first question for remaining please repost the question
Q: Use StatCrunch to determine the area under the standard normal density curve to the right of 1.10.…
A: We have to find the under the standard normal density curve to right of 1.10 Mathematically, we have…
Q: 11.) A 2010 newspaper article reported that the national average for calorie consumption of…
A: Given,sample size(n)=1200sample mean(x¯)=2650population standard deviation(σ)=120α=0.05
Q: 1. State the following: (a) Determine the value of a if the confidence interval is 99% required. (b)…
A: according to our policy we can answer only first three part for remaining please repost the…
Q: 2. I surveyed 150 adults in the U.S. and asked them how many hours of TV th watched on average per…
A: Note: Hi! Thank you for the question. As you have requested for parts D to L, according to our…
Q: ( If X₁, X2,..., Xn constitute a random sample of size n from a population given by 2(0 - x) for…
A:
Q: On your answer sheet, give one situation where each of the sampling methods is being applied.…
A: As per the Bartleby guildlines we have to solve first three subparts and rest can be reposted.....…


Trending now
This is a popular solution!

Step by step
Solved in 2 steps with 1 images

- We are doing an experiment to see if Psych majors do better on a test than Econ majors. The null hypothesis is that they do equally well on the test. We get the results, and Psych majors and Econ majors do equally well. What is our conclusion?A foreign car manufacturer advertises that its newest model, the Bullet, rarely stops at gas stations. In fact, they claimed that its EPA rating for highway driving is at least 32.5 mpg. However, the results of a recent independent study determined the mpg for 50 identical models of the Bullet, with these results: n = 50, x= 30.4 mpg, and s = 5.3 mpg.This report failed to offer any conclusion, and you have been asked to interpret these results by someone who has always felt that the 32.5 figure is too high. What would be your conclusion using a significance level of 5%?Z = 1.645A boss wants to show that productivity decreases when the boss leaves the office. An office of 26 employees handed in productivity reports when the boss was absent (M1=5, SS1=250) compared to 36 employees who handed in reports when the boss was present (M2=8, SS2=420). a) What is the null and alternative hypothesis? a Ho:μ 1-μ2≠0; H1:μ 1-μ2=0 b Ho:μ 1-μ2<0; H1:μ 1-μ2>0 c Ho:μ 1-μ2=0; H1:μ 1-μ2≠0 d Ho:μ 1-μ2>0; H1:μ 1-μ2<0 b) Compute tobt? c) Compute df? d) Given the α=0.05, compute the negative value of tcrit? e) Is tobt significant?
- I am most confused on how to know if you use less than or greater than for the alternative hypothesis??Could you please help me out with this question… Does ivy grow better in areas with more sun versus in shady areas? Formulate one null (H0) and one alternative (H1) hypothesis.A) The p− value is 0.7580. Reject the null hypothesis H0. The social media content associate has sufficient evidence that the average number of social media posts per day that helps to build an audience is different than 3 daily posts. B)The p− value is 0.2420. Reject the null hypothesis H0. The social media content associate has sufficient evidence that the average number of social media posts per day that helps to build an audience is different than 3 daily posts. C)The p− value is 0.7580. Fail to reject the null hypothesis H0. The social media content associate does NOT have sufficient evidence that the average number of social media posts per day that helps to build an audience is different than 3 daily posts. D)The p− value is 0.2420. Fail to reject the null hypothesis H0. The social media content associate does NOT have sufficient evidence that the average number of social media posts per day that helps to build an audience is different than 3 daily posts.
- A researcher selects a sample and administers a treatment for anxiety to the individuals in the sample. If the sample is used for a hypothesis test, what does the null hypothesis ( H 0) put forth about the treatment? a. The treatment multiplies each anxiety score by a constant. b. The treatment has an effect on anxiety. c. The treatment has no effect on anxiety. d. The treatment divides each anxiety score by a constant.A researcher wants to explore the differences in health effects from two different types of sugar. She hypothesizes that artificial sweetener has lower long term health benefits than natural sugar. What is her null hypothesis? Fill in the blank. H0: μArtificalSweetener__________ μNaturalSugar Group of answer choices a) Less than b) Less than or equal to c) Greater than d) Greater than or equal toA medical researcher wants to examine the relationship of the blood pressure of patients before and after a procedure. She takes a sample of people and measures their blood pressure before undergoing the procedure. Afterwards, she takes the same sample of people and measures their blood pressure again. The researcher wants to test if the blood pressure measurements after the procedure are different from the blood pressure measurements before the procedure. The hypotheses are as follows: Null Hypothesis: μD = 0, Alternative Hypothesis: μD ≠ 0. From her data, the researcher calculates a p-value of 0.5704. What is the appropriate conclusion? The difference was calculated as (after - before). Question 16 options: 1) The average difference in blood pressure is significantly different from 0. The blood pressures of patients differ significantly before and after the procedure. 2) We did not find enough evidence to say the average…
- A researcher hypothesizes that Drug A is more effective than Drug B. In conducting an analysis to test this hypothesis, how should the null hypothesis be stated? a. H0: μDrug A = μDrug B b. H0: μDrug A > μDrug B c. H0: μDrug A ≠ μDrug B d. H0: μDrug A < μDrug BAt a manufacturing company, the percent of defective items produced on the assembly line is 2%. The company is testing a new assembly line designed to reduce the percent of defective parts. The null and alternative hypotheses of the test are described as follows. H0:The percent of defective parts is at least 2%.Ha:The percent of defective parts is less than 2%. H0:The percent of defective parts is at least 2%.Ha:The percent of defective parts is less than 2%. Which of the following describes a Type IIII error that could result from the test?At a manufacturing company, the percent of defective items produced on the assembly line is 2%. The company is testing a new assembly line designed to reduce the percent of defective parts. The null and alternative hypotheses of the test are described as follows. H0:The percent of defective parts is at least 2%.Ha:The percent of defective parts is less than 2%.H0:The percent of defective parts is at least 2%.Ha:The percent of defective parts is less than 2%. Which of the following describes a Type IIII error that could result from the test? The test does not provide convincing evidence that the percent is less than 2%, but the actual percent is 3%. A The test does not provide convincing evidence that the percent is less than 2%, but the actual percent is 2%. B The test does not provide convincing evidence that the percent is less than 2%, but the actual percent is 1%. C The test provides convincing evidence that the percent is less than 2%, but the…