Assuming the model is re-estimated with additional new variable (lagged of LGDP), based on the new estimated results, what is your conclusion about the autocorrelation diagnostic test? If there is diagnostic problem, show how to solve the problem.
Assuming the model is re-estimated with additional new variable (lagged of LGDP), based on the new estimated results, what is your conclusion about the autocorrelation diagnostic test? If there is diagnostic problem, show how to solve the problem.

Linear Algebra: A Modern Introduction
4th Edition
ISBN:9781285463247
Author:David Poole
Publisher:David Poole
Chapter7: Distance And Approximation
Section7.3: Least Squares Approximation
Problem 31EQ

Related questions
Question
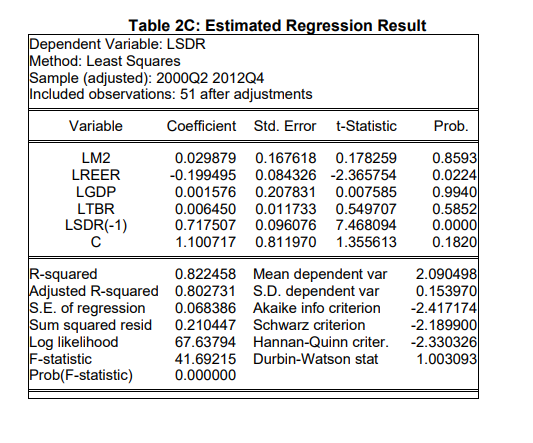
Assuming the model is re-estimated with additional new variable (lagged of
LGDP), based on the new estimated results, what is your conclusion about the
autocorrelation diagnostic test? If there is diagnostic problem, show how to
solve the problem.
Transcribed Image Text:Table 2C: Estimated Regression Result
Dependent Variable: LSDR
Method: Least Squares
Sample (adjusted): 2000Q2 2012Q4
Included observations: 51 after adjustments
Variable
LM2
LREER
LGDP
LTBR
LSDR(-1)
с
R-squared
Adjusted R-squared
S.E. of regression
Sum squared resid
Log likelihood
F-statistic
Prob(F-statistic)
Coefficient Std. Error t-Statistic
Prob.
0.8593
0.0224
0.029879 0.167618 0.178259
-0.199495 0.084326 -2.365754
0.001576 0.207831 0.007585
0.006450 0.011733
0.9940
0.549707
0.5852
0.717507 0.096076 7.468094 0.0000
1.100717 0.811970 1.355613
0.1820
Mean dependent var
0.822458
0.802731 S.D. dependent var
0.068386
Akaike info criterion
0.210447
Schwarz criterion
67.63794 Hannan-Quinn criter.
41.69215
Durbin-Watson stat
0.000000
2.090498
0.153970
-2.417174
-2.189900
-2.330326
1.003093
Expert Solution
This question has been solved!
Explore an expertly crafted, step-by-step solution for a thorough understanding of key concepts.

Step by step
Solved in 2 steps

Recommended textbooks for you
Linear Algebra: A Modern Introduction
Algebra
ISBN:
9781285463247
Author:
David Poole
Publisher:
Cengage Learning

Trigonometry (MindTap Course List)
Trigonometry
ISBN:
9781305652224
Author:
Charles P. McKeague, Mark D. Turner
Publisher:
Cengage Learning

Algebra & Trigonometry with Analytic Geometry
Algebra
ISBN:
9781133382119
Author:
Swokowski
Publisher:
Cengage
Linear Algebra: A Modern Introduction
Algebra
ISBN:
9781285463247
Author:
David Poole
Publisher:
Cengage Learning
Trigonometry (MindTap Course List)
Trigonometry
ISBN:
9781305652224
Author:
Charles P. McKeague, Mark D. Turner
Publisher:
Cengage Learning
Algebra & Trigonometry with Analytic Geometry
Algebra
ISBN:
9781133382119
Author:
Swokowski
Publisher:
Cengage

College Algebra
Algebra
ISBN:
9781305115545
Author:
James Stewart, Lothar Redlin, Saleem Watson
Publisher:
Cengage Learning

Algebra and Trigonometry (MindTap Course List)
Algebra
ISBN:
9781305071742
Author:
James Stewart, Lothar Redlin, Saleem Watson
Publisher:
Cengage Learning