ASSUMPTIONS OF REGRESSION MODEL Method of Detection Departures Violations on Assumptions Effects of the violations on the model Remedial Measures Graphical Statistical The model ts al but one or a few outler observation. 6. The error terms are not normally distributed 6. There is exact linear relationship or exact
ASSUMPTIONS OF REGRESSION MODEL Method of Detection Departures Violations on Assumptions Effects of the violations on the model Remedial Measures Graphical Statistical The model ts al but one or a few outler observation. 6. The error terms are not normally distributed 6. There is exact linear relationship or exact

Functions and Change: A Modeling Approach to College Algebra (MindTap Course List)
6th Edition
ISBN:9781337111348
Author:Bruce Crauder, Benny Evans, Alan Noell
Publisher:Bruce Crauder, Benny Evans, Alan Noell
Chapter3: Straight Lines And Linear Functions
Section3.CR: Chapter Review Exercises
Problem 15CR: Life Expectancy The following table shows the average life expectancy, in years, of a child born in...

Related questions
Question
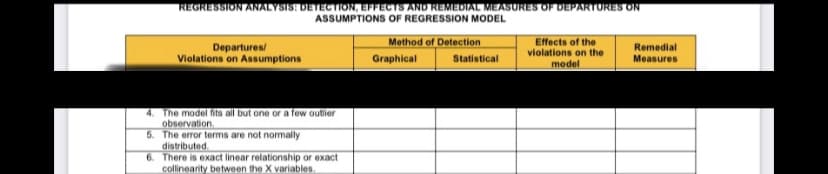
Transcribed Image Text:REGRESSION ANALYSIS: DETECTION, EFFECTS AND REMEDIAL MEASURES OF DEPARTURES ON
ASSUMPTIONS OF REGRESSION MODEL
Method of Detection
Departures/
Violations on Assumptions
Effects of the
violations on the
Remedial
Graphical
Statistical
Measures
model
4. The model fits all but one or a few outlier
observation.
5. The error terms are not nomally
distributed.
6. There is exact linear relationship or exact
collinearity between the X variables.
Expert Solution
This question has been solved!
Explore an expertly crafted, step-by-step solution for a thorough understanding of key concepts.

Step by step
Solved in 3 steps

Recommended textbooks for you
Functions and Change: A Modeling Approach to Coll…
Algebra
ISBN:
9781337111348
Author:
Bruce Crauder, Benny Evans, Alan Noell
Publisher:
Cengage Learning

College Algebra
Algebra
ISBN:
9781305115545
Author:
James Stewart, Lothar Redlin, Saleem Watson
Publisher:
Cengage Learning

Algebra and Trigonometry (MindTap Course List)
Algebra
ISBN:
9781305071742
Author:
James Stewart, Lothar Redlin, Saleem Watson
Publisher:
Cengage Learning
Functions and Change: A Modeling Approach to Coll…
Algebra
ISBN:
9781337111348
Author:
Bruce Crauder, Benny Evans, Alan Noell
Publisher:
Cengage Learning
College Algebra
Algebra
ISBN:
9781305115545
Author:
James Stewart, Lothar Redlin, Saleem Watson
Publisher:
Cengage Learning
Algebra and Trigonometry (MindTap Course List)
Algebra
ISBN:
9781305071742
Author:
James Stewart, Lothar Redlin, Saleem Watson
Publisher:
Cengage Learning

Algebra & Trigonometry with Analytic Geometry
Algebra
ISBN:
9781133382119
Author:
Swokowski
Publisher:
Cengage