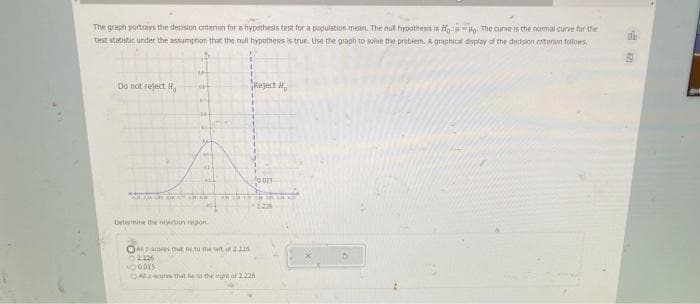
The graph portsays the decision critenon fora hypothesis test for a population mean. The nu hypotheses is Ha The curve is the normal curve for the test statistic under the assumption that the null hypothess is true. Use the graph to solve the prebien. A graphical dsplay of the dedsion ontenon tolows, Do not reject H, Determie the etion regon. O tht to the o2226 OANo tht eto the n f2226


Q: An article in the Journal of the American Ceramic Society, "Rapid Hot-Pressing of Ultrafine PSZ…
A:
Q: To evaluate effectiveness of a processor for a certain type of tasks, we recorded the CPU time for n…
A: Given that To evaluate effectiveness of a processor for a certain type of tasks, we recorded the…
Q: Two random samples of sizesn= 10 and n = 12 from chemistry course and physics course respectively,…
A: Given that Chemistry mean Xc= 60 Standard deviation Sc= 6.5 Physics Mean Xp= 72 Standard…
Q: Water and Carbohydrates Here are the number of grams of water and the number of grams of…
A: (1) Use EXCEL to obtain the value correlation coefficient r: EXCEL procedure: Go to EXCEL…
Q: How will the MAGNITUDE of the critical value for a two-tailed test compare to the critical value of…
A: here given that comparing critical values of two tails and one tail test for same level of…
Q: An oil company conducts a geological study that indicates that an exploratory oil well should have a…
A: Here an oil comapny conducts a geological study that indicates an exploratory oil well should have a…
Q: According to a recent study, if a person smoked, the average number of cigarettes smoked per day was…
A:
Q: A man is on trial accused of murder in the first degree. The prosecutor presents evidence that he…
A:
Q: 19. Adaptive expectation can be sometimes accurate but rational expectation A. may not be accurate.…
A: Since you have asked multiple questions, we will solve the first question for you. If you want any…
Q: • TYPE OF TEST (one-tailed left test, one-tailed right, none-tailed, two-tailed • TEST STATIC…
A: As per company guidelines I solved exactly three subparts of the question.thank you
Q: 2A random variable has a pimit given by olw Fand ECx) W Var (x)
A: Solution
Q: A population of values has a normal distribution with u = 26.4 and o = 50.3. You intend to draw a…
A:
Q: 7. Suppose a game is to be played with a single die, assumed fair, where the player wins the dollar…
A:
Q: What is the confidence interval estimate of the population mean p? (Round to three decimal places as…
A: Data set include 103 body temperature; n=103 x¯=98.5s=0.61
Q: Annie is concerned over a report that "a woman over age 4040 has a better chance of being killed by…
A: Givensample size(n)=513No.of women reported as married(x)=23p^=xn=23513≅0.0448significance…
Q: Please answer questions d to g
A:
Q: In a survey, 15 people were asked how much they spent on their child's last birthday gift. The…
A: The random variable X follows normal distribution. We have to construct 98% confidence interval.…
Q: For the standard normal distribution, find the value of c such that: P(z > c) = 0.0682
A:
Q: Data for a certain community show that 18% of the adult residents are German. Suppose 74 people are…
A: Given that Sample size n=74 Favorable cases x =12 Sample proportion p^=x/n =12/74 =0.1622
Q: Do political science classes require more writing than history classes? The 54 randomly selected…
A: GivenFor political science classesn1=54x1=16.4s1=4.8For History classesn2=52x2=15.8s2=4.6α=0.10
Q: A teacher administers a standardized math .4 test to his class of 75 students. the mean score (out…
A: Here's, mean is 235 and standard deviation is 28. Sample number is 75. We will use one sample…
Q: For a chi-square goodness-of-fit test for a normal distribution using 7 categories with estimated…
A: It is given that Number of categories k = 7 Mean and SD are estimated.
Q: SHOW COMPLETE SOLUTION Suppose the probability is 0.7 that any given person will believe a tale…
A:
Q: y x y x 1 60 5 85 0 63 4 89 1 65 6 90 2 70 8 90 5 70 4 90 1 70 5 90 4 80 7 94 6 90 9 100 2 80 7 100…
A: Use the Excel and Perform the Regression. Followings are the Steps to perform the Regression 1) Open…
Q: (3) The beta parameter is the slope of the line between the predictor and outcome variables. A. TRUE…
A: Given problem Given that The beta parameter is the slope of the line between the predictor and…
Q: 4. Sales, in million pesos, of a certain company are shown here. 8 9 P20 P22 P24 Year (X) Sales (Y)…
A: The question is based on regression Given :
Q: Given the data below, test the hypothesis that job satisfaction (0 to 100 scale) is the same at…
A:
Q: have given each car a probability based on how likely they think Caleb is to choose that car. Devin…
A: Here Given Devin has choose bet on Toyota or the JEEP. And Probability they choose TOYOTA-0.4=…
Q: The following table shows the number of years of school, x, completed by ten randomly selected…
A:
Q: Given the following stem-and-leaf plot/diagram. The number occurred the most is A. 22 B. 3 C. 33 D.…
A:
Q: The table and scatter plot show the time spent watching TV, x, and the time spent doing homework, y,…
A: Formula to find residual is , Residual = Observed value - Predicted value = y - y^
Q: An article in the Journal of Sound and Vibration (Vol. 151, 1991, pp. 383-394) described a study…
A: For the given data Find Slope =?
Q: Compute the following. 8C3=
A:
Q: 4. A company manufactures drugs intended to lower the cholesterol level (Y, measured in mg/dL) in…
A: Given information: Probability of assigning patient to treatement group=23Probability of assigning…
Q: Executives at The Walt Disney Company are interested in estimating the mean spending per capita for…
A: Given information: Class interval Observed Expected Under 50 10 50 70 26.00 70 90 55.00…
Q: The table and scatter plot show the number of years of experience, x, and the hourly pay rate, v,…
A: Given that -
Q: Activity: Show complete solutions for each item. Locate the following percentile under the normal…
A: Hello! As you have posted more than 3 sub parts, we are answering the first 3 sub-parts. In case…
Q: On an intelligence test, the mean number of raw items correct is 235 and the standard deviation is…
A:
Q: The table below shows the number of athletes who stretch before exercising and how many had injuries…
A:
Q: Answer the questions using complete sentences. a. What is an influential point? How should…
A:
Q: aste test of randomly selected students was conducted to see if there was a difference in…
A: to find Expected number = ?
Q: he Figure is a Normal Distribution Determine: a. Mean b. Standard Deviation c. Magnitude at 25…
A: Mean x¯=∑fixi∑f Standard Deviation σx=∑fixi-x¯2N or =n∑fx2-∑fx2n(n-1)
Q: 2A random variable has a pimif given by olw
A: Solution
Q: Use the 2016 FICA tax rates, shown below, to answer the following question. If a taxpayer is not…
A: Given that, A taxpayer is not self-employed and earns $136,000. Employee rates: 7.65% on first…
Q: What is the following: 1. Sum of XY? 2. a = ? 3. b = ?
A: Given example are secular trend.
Q: a) Estimate the intercept Bo and slope B1 regression coefficients. Write the estimated regression…
A: Since you have posted a question with multiple sub-parts, we will solve first three sub- parts for…
Q: The scatter plot shows the number of hours worked, x, and the amount of money spent on…
A: Given that - The scatter plot shows the number of hours worked, x, and the amount of money spent on…
Q: An article in the Journal of the American Ceramic Society, "Rapid Hot-Pressing of Ultrafine PSZ…
A: For the given data Intercept = ?
Q: Define what is a Confidence Interval in Statistics and how we can apply it to a real life situation
A: Given that Confidence interval in Statistics and how to apply in real life situation....
Q: Alumni Contributions Numbers for the amount of an alumnus's contribution (in dollars) and the years…
A: Solution

Step by step
Solved in 2 steps with 2 images

- In each of Exercises, we have specified the “tailedness” of a hypothesis test for a population mean with null hypothesis H0: µ = µ0. For each exercise, a.draw the ideal power curve.b.explain what your curve in part (a) portrays.right-tailedIn each of Exercises, we have specified the “tailedness” of a hypothesis test for a population mean with null hypothesis H0: µ = µ0. For each exercise, a.draw the ideal power curve.b.explain what your curve in part (a) portrays.left-tailedA research center claims that at least 31% of adults in a certain country think that their taxes will be audited. In a random sample of 800 adults in that country in a recent year, 26% say they are concerned that their taxes will be audited. At α=0.10, is there enough evidence to reject the center's claim? Complete parts (a) through (e) below. (a) Identify the claim and state H0 and Ha. Identify the claim in this scenario. Select the correct choice below and fill in the answer box to complete your choice. (Type an integer or a decimal. Do not round.) A. The percentage of adults in the country who think that their taxes will be audited is not enter your response here%. B. enter your response here% of adults in the country think that their taxes will be audited. C. Less than enter your response here% of adults in the country think that their taxes will be audited. D. At least enter your response here% of adults in the country think…
- A research center claims that at least 31% of adults in a certain country think that their taxes will be audited. In a random sample of 800 adults in that country in a recent year, 28% say they are concerned that their taxes will be audited. At α=0.10, is there enough evidence to reject the center's claim? Complete parts (a) through (e) below. (a) Identify the claim and state H0 and Ha. Identify the claim in this scenario. Select the correct choice below and fill in the answer box to complete your choice. (Type an integer or a decimal. Do not round.) A. ______% of adults in the country think that their taxes will be audited. B. The percentage of adults in the country who think that their taxes will be audited is not ______%. C. Less than ______% of adults in the country think that their taxes will be audited. D. At least ______% of adults in the country think that their taxes will be audited. (b) Find the critical value(s) and identify the rejection region(s). (c)…A research center claims that at least 28% of adults in a certain country think that their taxes will be audited. In a random sample of1000 adults in that country in a recent year, 23%say they are concerned that their taxes will be audited. At α=0.10, is there enough evidence to reject the center's claim? Complete parts (a) through (e) below. (a) Identify the claim and state H0 and Ha. Identify the claim in this scenario. Select the correct choice below and fill in the answer box to complete your choice. (Type an integer or a decimal. Do not round.) A. nothing% of adults in the country think that their taxes will be audited. B. Less than nothing% of adults in the country think that their taxes will be audited. C. At least nothing% of adults in the country think that their taxes will be audited. D. The percentage of adults in the country who think that their taxes will be audited is not nothing%. Let p be the population proportion of…A medical researcher says that less than 74%of adults in a certain country think that healthy children should be required to be vaccinated. In a random sample of 600adults in that country, 71% think that healthy children should be required to be vaccinated. At α=0.01, is there enough evidence to support the researcher's claim? Complete parts (a) through (e) below. (a) Identify the claim and state H0 andHa. Identify the claim in this scenario. Select the correct choice below and fill in the answer box to complete your choice. (Type an integer or a decimal. Do not round.) Fill the percentage on the correct answer A. % of adults in the country think that healthy children should be required to be vaccinated. B. Less than %of adults in the country think that healthy children should be required to be vaccinated. C. The percentage of adults in the country who think that healthy children should be required to be vaccinated is not %. D. More than…
- In the tt-test of significance for the hypotheses H0:μ=11 and Ha:μ<11, the value of the test statistic was found to be t = 1.205 using a sample of size 18. Estimate the upper bound for the P-value associated with this test. That is, fill in the blank P <P< _____. Please show work!1a) Derive a maximum-liklihood estimator for the unknown parameter Y 1b) An experienced sales person completes sales following a Poisson distribution, with a mean rate of Y = 1.8 sales/month. A junior sales person completes sales at a mean rate of Y = 0.85 sales per month Find the probability of the joint sales team (experienced and junior) completing exactly 2 sales in any given months, assuming the two sales people act independently of each other. 1c) Find the probability of the joint sales team (experienced and junior) completing more than 2 sales in any given months2a) The number of flowers per square meter in Sarah’s garden has a Poisson distribution with mean 0.35. Her garden is covered with 150 square meters of grass. Find lambda λ? 2b) The number of flowers per square meter in Sarah’s garden has a Poisson distribution with mean 0.35. Her garden is covered with 150 square meters of grass. Using Normal approximation, we will need to find the probability that the Sarah’s garden will contain less than 45 flowers. First graph and answer what is the continuity correction? 2c) Using the previous results for lambda and continuity correction, find z, then graph and use your table to find φ table value of z Write down your final answer for the probability that Sarah’s garden will contain less than 45 flowers as a decimal number with 4 decimal places.
- The proportion p of residents in a community who recycle has traditionally been 60%. A policy maker claims that the proportion is less than 60% now that one of the recycling centers has been relocated. If 116 out of a random sample of 225 residents in the community said they recycle, is there enough evidence to support the policy maker's claim at the 0.01 level of significance? Perform a one-tailed test. Then complete the parts below.Carry your intermediate computations to three or more decimal places. A. State the null hypothesis Ho and the alternative hypothesis H1 Ho: H1: B. Find the value of the test statistic. (Round to three or more decimal places.) C. Find the critical value. (Round to three or more decimal places.) D. Is there enough evidence to support the policy maker's claim that the proportion of residents who recycle is less than 60%? (Yes or no) .The proportion p of residents in a community who recycle has traditionally been 60%. A policy maker claims that the proportion is less than 60% now that one of the recycling centers has been relocated. If 128 out of a random sample of 225 residents in the community said they recycle, is there enough evidence to support the policy maker's claim at the 0.05 level of significance? Perform a one-tailed test. Then complete the parts below. Carry your intermediate computations to three or more decimal places. A. State the null hypothesis H0 and the alternative hypothesis H1. H0: H1: B. Determine the type of test statistic to use. Is it (Z) (T) (Chi-square) or (F)? .The proportion p of residents in a community who recycle has traditionally been 60%. A policy maker claims that the proportion is less than 60% now that one of the recycling centers has been relocated. If 128 out of a random sample of 225 residents in the community said they recycle, is there enough evidence to support the policy maker's claim at the 0.05 level of significance? Perform a one-tailed test. Then complete the parts below. Carry your intermediate computations to three or more decimal places. A. Find the value of the test statistic. (Round to three or more decimal places.) B. Find the critical value. (Round to three or more decimal places.) C. Is there enough evidence to support the policy maker's claim that the proportion of residents who recycle is less than 60%? (Yes or No)