At a local veterinary office, 48% of dogs get their teeth cleaned, while 35% of cats get their teeth cleaned. Let P, and P be the sample proportions of dogs and cats at this veterinary office, respectively, who get their teeth cleaned. Suppose 25 dogs and 32 cats from this veterinary office are selected at random to collect data on their teeth-cleaning history. Which of the following is the correct calculation and interpretation of the standard deviation of the sampling distribution of Pp-Pc ? The difference (dogs - cats) in the sample proportions of those that get their teeth cleaned typically varies about 0.003 from the true difference in proportions. The difference (dogs - cats) in the sample proportions of those that get their teeth cleaned typically varies about 0.017 from the true difference in proportions. The difference (dogs - cats) in the sample proportions of those that get their teeth cleaned typically varies about 0.054 from the true difference in proportions. The difference (dogs - cats) in the sample proportions of those that get their teeth cleaned typically varies about 0.131 from the true difference in proportions.
At a local veterinary office, 48% of dogs get their teeth cleaned, while 35% of cats get their teeth cleaned. Let P, and P be the sample proportions of dogs and cats at this veterinary office, respectively, who get their teeth cleaned. Suppose 25 dogs and 32 cats from this veterinary office are selected at random to collect data on their teeth-cleaning history. Which of the following is the correct calculation and interpretation of the standard deviation of the sampling distribution of Pp-Pc ? The difference (dogs - cats) in the sample proportions of those that get their teeth cleaned typically varies about 0.003 from the true difference in proportions. The difference (dogs - cats) in the sample proportions of those that get their teeth cleaned typically varies about 0.017 from the true difference in proportions. The difference (dogs - cats) in the sample proportions of those that get their teeth cleaned typically varies about 0.054 from the true difference in proportions. The difference (dogs - cats) in the sample proportions of those that get their teeth cleaned typically varies about 0.131 from the true difference in proportions.

MATLAB: An Introduction with Applications
6th Edition
ISBN:9781119256830
Author:Amos Gilat
Publisher:Amos Gilat
Chapter1: Starting With Matlab
Section: Chapter Questions
Problem 1P

Related questions

Question
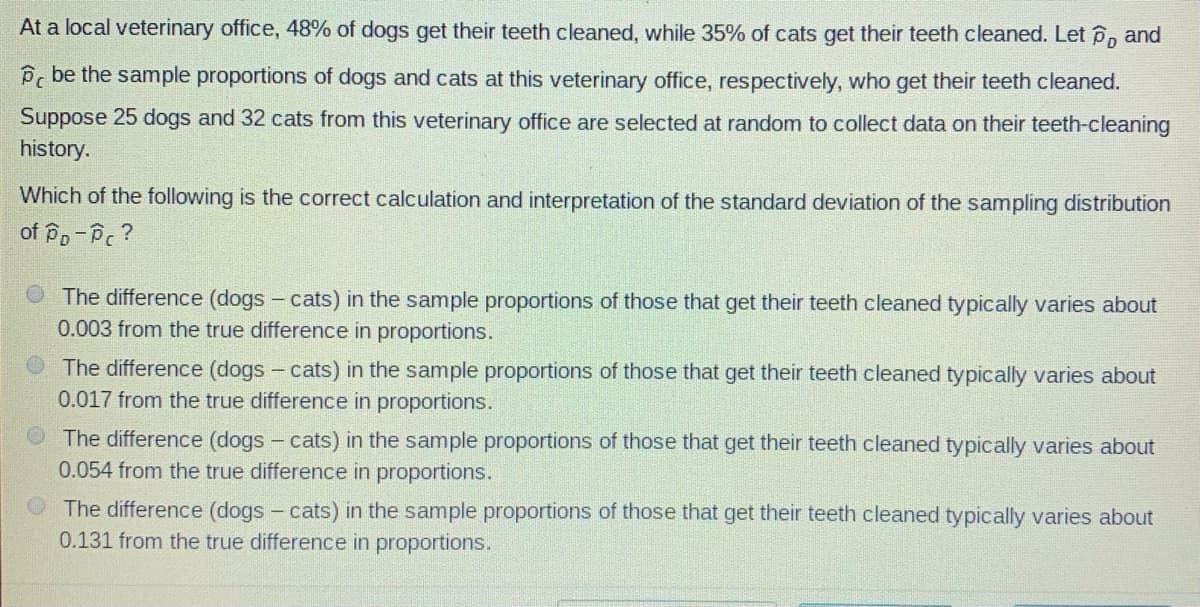
Transcribed Image Text:At a local veterinary office, 48% of dogs get their teeth cleaned, while 35% of cats get their teeth cleaned. Let P, and
Pc be the sample proportions of dogs and cats at this veterinary office, respectively, who get their teeth cleaned.
Suppose 25 dogs and 32 cats from this veterinary office are selected at random to collect data on their teeth-cleaning
history.
Which of the following is the correct calculation and interpretation of the standard deviation of the sampling distribution
of Po-Pc ?
O The difference (dogs - cats) in the sample proportions of those that get their teeth cleaned typically varies about
0.003 from the true difference in proportions.
The difference (dogs - cats) in the sample proportions of those that get their teeth cleaned typically varies about
0.017 from the true difference in proportions.
The difference (dogs - cats) in the sample proportions of those that get their teeth cleaned typically varies about
0.054 from the true difference in proportions.
The difference (dogs - cats) in the sample proportions of those that get their teeth cleaned typically varies about
0.131 from the true difference in proportions.
Transcribed Image Text:000
00
+
+
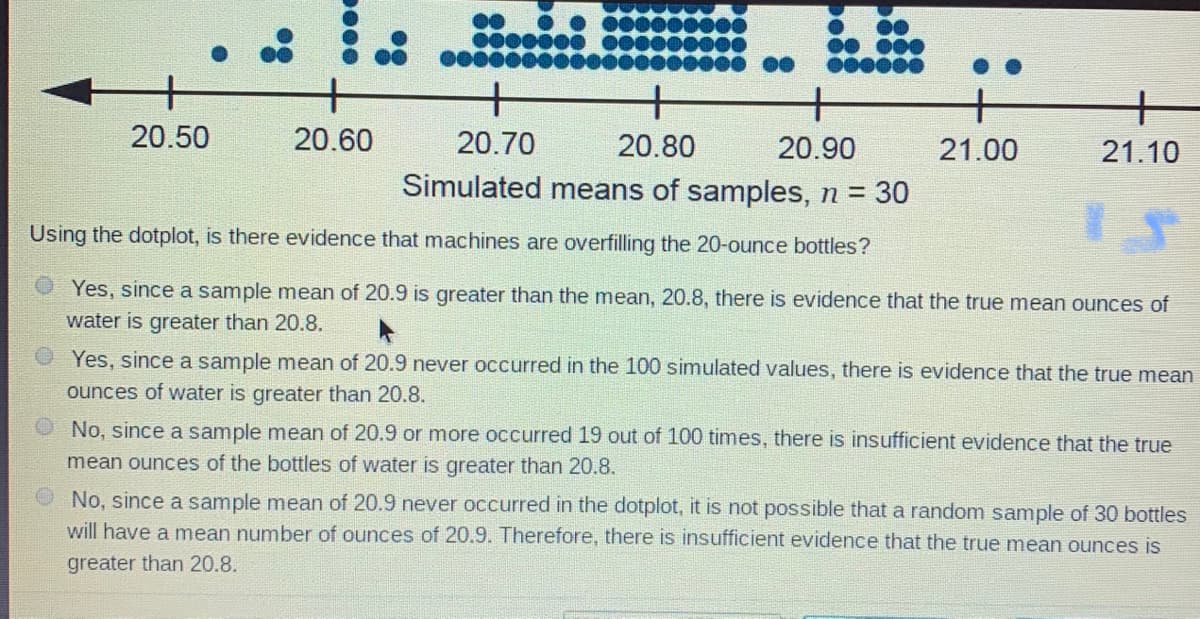
20.50
20.60
20.70
20.80
20.90
21.00
21.10
Simulated means of samples, n = 30
Using the dotplot, is there evidence that machines are overfilling the 20-ounce bottles?
Yes, since a sample mean of 20.9 is greater than the mean, 20.8, there is evidence that the true mean ounces of
water is greater than 20.8.
Yes, since a sample mean of 20.9 never occurred in the 100 simulated values, there is evidence that the true mean
ounces of water is greater than 20.8.
No, since a sample mean of 20.9 or more occurred 19 out of 100 times, there is insufficient evidence that the true
mean ounces of the bottles of water is greater than 20.8.
ONo, since a sample mean of 20.9 never occurred in the dotplot, it is not possible that a random sample of 30 bottles
will have a mean number of ounces of 20.9. Therefore, there is insufficient evidence that the true mean ounces is
greater than 20.8.
Expert Solution
This question has been solved!
Explore an expertly crafted, step-by-step solution for a thorough understanding of key concepts.

This is a popular solution!

Trending now
This is a popular solution!

Step by step
Solved in 2 steps with 2 images

Knowledge Booster


Learn more about
Need a deep-dive on the concept behind this application? Look no further. Learn more about this topic, statistics and related others by exploring similar questions and additional content below.Recommended textbooks for you
MATLAB: An Introduction with Applications
Statistics
ISBN:
9781119256830
Author:
Amos Gilat
Publisher:
John Wiley & Sons Inc

Probability and Statistics for Engineering and th…
Statistics
ISBN:
9781305251809
Author:
Jay L. Devore
Publisher:
Cengage Learning

Statistics for The Behavioral Sciences (MindTap C…
Statistics
ISBN:
9781305504912
Author:
Frederick J Gravetter, Larry B. Wallnau
Publisher:
Cengage Learning
MATLAB: An Introduction with Applications
Statistics
ISBN:
9781119256830
Author:
Amos Gilat
Publisher:
John Wiley & Sons Inc
Probability and Statistics for Engineering and th…
Statistics
ISBN:
9781305251809
Author:
Jay L. Devore
Publisher:
Cengage Learning
Statistics for The Behavioral Sciences (MindTap C…
Statistics
ISBN:
9781305504912
Author:
Frederick J Gravetter, Larry B. Wallnau
Publisher:
Cengage Learning

Elementary Statistics: Picturing the World (7th E…
Statistics
ISBN:
9780134683416
Author:
Ron Larson, Betsy Farber
Publisher:
PEARSON

The Basic Practice of Statistics
Statistics
ISBN:
9781319042578
Author:
David S. Moore, William I. Notz, Michael A. Fligner
Publisher:
W. H. Freeman

Introduction to the Practice of Statistics
Statistics
ISBN:
9781319013387
Author:
David S. Moore, George P. McCabe, Bruce A. Craig
Publisher:
W. H. Freeman