According to the CDC, in 2015 15% of high school students rode with a driver (in the last 30 days) who had been drinking alcohol. A random sample 12 high school students was chosen. Assume the distribution is normal. Use the Binomial Distribution Table (PDF, 739 KB) (opens in new window) to find the probabilities. Please note, this question is specifically assessing your ability to use the table to find the probability. You may get a slightly different answer due to rounding if you use a calculator or other technology. 1. At least 11 have ridden with a drunk driver. P(r < + 15) = 0 2. Less than 4 have ridden with a drunk driver. P(r < : 4) = 0.5981 3. No more than 2 have ridden with a drunk driver. P(r : 2) = 4. Exactly 9 have ridden with a drunk driver. P(r : 11) = 5. At least 1 have ridden with a drunk driver. P(r : 1) = 6. Between 2 and 4 (exclusive) have ridden with a drunk driver. P(2 4) =
According to the CDC, in 2015 15% of high school students rode with a driver (in the last 30 days) who had been drinking alcohol. A random sample 12 high school students was chosen. Assume the distribution is normal. Use the Binomial Distribution Table (PDF, 739 KB) (opens in new window) to find the probabilities. Please note, this question is specifically assessing your ability to use the table to find the probability. You may get a slightly different answer due to rounding if you use a calculator or other technology. 1. At least 11 have ridden with a drunk driver. P(r < + 15) = 0 2. Less than 4 have ridden with a drunk driver. P(r < : 4) = 0.5981 3. No more than 2 have ridden with a drunk driver. P(r : 2) = 4. Exactly 9 have ridden with a drunk driver. P(r : 11) = 5. At least 1 have ridden with a drunk driver. P(r : 1) = 6. Between 2 and 4 (exclusive) have ridden with a drunk driver. P(2 4) =

College Algebra
7th Edition
ISBN:9781305115545
Author:James Stewart, Lothar Redlin, Saleem Watson
Publisher:James Stewart, Lothar Redlin, Saleem Watson
Chapter9: Counting And Probability
Section9.3: Binomial Probability
Problem 2E: If a binomial experiment has probability p success, then the probability of failure is...

Related questions

Question
can you answer the ones blank
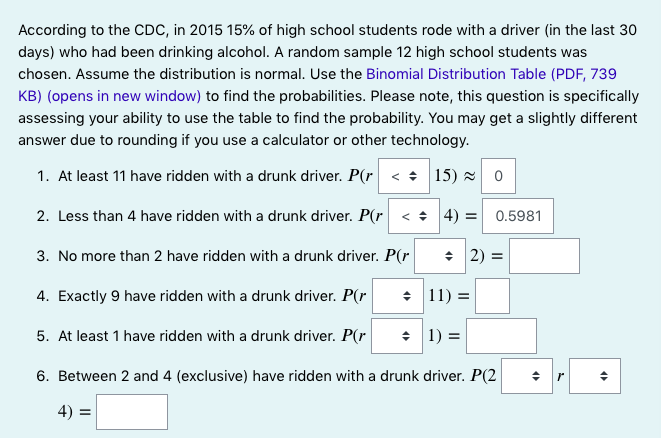
Transcribed Image Text:According to the CDC, in 2015 15% of high school students rode with a driver (in the last 30
days) who had been drinking alcohol. A random sample 12 high school students was
chosen. Assume the distribution is normal. Use the Binomial Distribution Table (PDF, 739
KB) (opens in new window) to find the probabilities. Please note, this question is specifically
assessing your ability to use the table to find the probability. You may get a slightly different
answer due to rounding if you use a calculator or other technology.
1. At least 11 have ridden with a drunk driver. P(r < : 15) 2
2. Less than 4 have ridden with a drunk driver. P(r
< + 4) = 0.5981
%3D
3. No more than 2 have ridden with a drunk driver. P(r
+ 2) =
4. Exactly 9 have ridden with a drunk driver. P(r
+ 11) =
5. At least 1 have ridden with a drunk driver. P(r
: 1) =
6. Between 2 and 4 (exclusive) have ridden with a drunk driver. P(2
4) =
Expert Solution
This question has been solved!
Explore an expertly crafted, step-by-step solution for a thorough understanding of key concepts.

This is a popular solution!

Trending now
This is a popular solution!

Step by step
Solved in 4 steps with 3 images

Follow-up Questions
Read through expert solutions to related follow-up questions below.
Follow-up Question
At least 11 have ridden with a drunk driver P (r>15
Solution
Knowledge Booster


Learn more about
Need a deep-dive on the concept behind this application? Look no further. Learn more about this topic, probability and related others by exploring similar questions and additional content below.Recommended textbooks for you
College Algebra
Algebra
ISBN:
9781305115545
Author:
James Stewart, Lothar Redlin, Saleem Watson
Publisher:
Cengage Learning

College Algebra
Algebra
ISBN:
9781305115545
Author:
James Stewart, Lothar Redlin, Saleem Watson
Publisher:
Cengage Learning