At the 0.05 level of significance, does the data provide evidence to suggest that consumers in the Northeast spend more on average than the national average reported in the Bureau of Labor Statistics? Select the correct hypothesis test for this problem:
At the 0.05 level of significance, does the data provide evidence to suggest that consumers in the Northeast spend more on average than the national average reported in the Bureau of Labor Statistics? Select the correct hypothesis test for this problem:

Big Ideas Math A Bridge To Success Algebra 1: Student Edition 2015
1st Edition
ISBN:9781680331141
Author:HOUGHTON MIFFLIN HARCOURT
Publisher:HOUGHTON MIFFLIN HARCOURT
Chapter11: Data Analysis And Displays
Section11.4: Two-ways Tables
Problem 5E

Related questions

Question
At the 0.05 level of significance, does the data provide evidence to suggest that consumers in the Northeast spend more on average than the national average reported in the Bureau of Labor Statistics?
Select the correct hypothesis test for this problem:
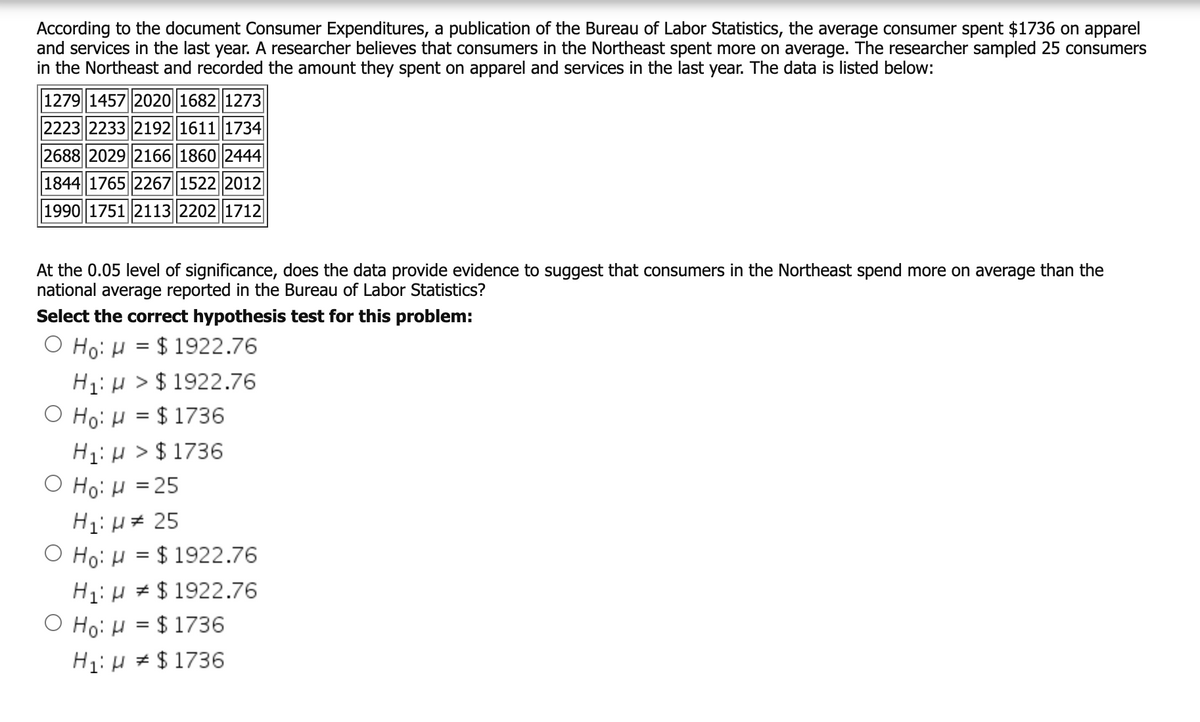
Transcribed Image Text:According to the document Consumer Expenditures, a publication of the Bureau of Labor Statistics, the average consumer spent $1736 on apparel
and services in the last year. A researcher believes that consumers in the Northeast spent more on average. The researcher sampled 25 consumers
in the Northeast and recorded the amount they spent on apparel and services in the last year. The data is listed below:
1279 1457 2020 1682 1273
2223 2233 2192 1611 1734
2688 2029 2166 1860 2444
1844 1765 2267 1522 2012
1990 1751 2113 2202 1712
At the 0.05 level of significance, does the data provide evidence to suggest that consumers in the Northeast spend more on average than the
national average reported in the Bureau of Labor Statistics?
Select the correct hypothesis test for this problem:
O Ho: H = $ 1922.76
H1: H > $ 1922.76
Ο H0: μ=$ 1736
H1: H > $ 1736
Ο H0: μ- 25
H1: H= 25
O Ho: H = $ 1922.76
H1: µ # $ 1922.76
Ο H: μ= $ 1736
H1: H # $ 1736
Expert Solution
This question has been solved!
Explore an expertly crafted, step-by-step solution for a thorough understanding of key concepts.

Step by step
Solved in 2 steps

Knowledge Booster


Learn more about
Need a deep-dive on the concept behind this application? Look no further. Learn more about this topic, statistics and related others by exploring similar questions and additional content below.Recommended textbooks for you
Big Ideas Math A Bridge To Success Algebra 1: Stu…
Algebra
ISBN:
9781680331141
Author:
HOUGHTON MIFFLIN HARCOURT
Publisher:
Houghton Mifflin Harcourt

Holt Mcdougal Larson Pre-algebra: Student Edition…
Algebra
ISBN:
9780547587776
Author:
HOLT MCDOUGAL
Publisher:
HOLT MCDOUGAL

Glencoe Algebra 1, Student Edition, 9780079039897…
Algebra
ISBN:
9780079039897
Author:
Carter
Publisher:
McGraw Hill
Big Ideas Math A Bridge To Success Algebra 1: Stu…
Algebra
ISBN:
9781680331141
Author:
HOUGHTON MIFFLIN HARCOURT
Publisher:
Houghton Mifflin Harcourt
Holt Mcdougal Larson Pre-algebra: Student Edition…
Algebra
ISBN:
9780547587776
Author:
HOLT MCDOUGAL
Publisher:
HOLT MCDOUGAL
Glencoe Algebra 1, Student Edition, 9780079039897…
Algebra
ISBN:
9780079039897
Author:
Carter
Publisher:
McGraw Hill