ATST(min/24h Age 586 4.4 461.75 14 491.1 10.1 565 6.7 462 11.5 532.1 9.6 477.6 12.4 515.2 8.9 493 11.1 528.3 7.75 575.9 5.5 532.5 8.6 530.5 7.2


A group of 13 healthy children and adolescents participated in a phycological study designed to analyze the relationship between age and average total sleep time (ATST). To obtain a measure for ATST (in minutes), recordings were taken on each subject on three consecutive nights and then averaged. Results are provided to you in Sleep&Age.xlsx Download Sleep&Age.xlsx file. (2 points) Determine the least-squares regression line for predicting average total sleep time using age. (2 points) Make a
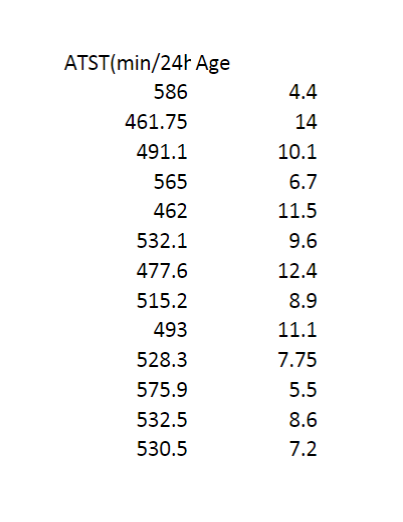
A group of 13 healthy children and adolescents participated in a phycological study designed to analyze the relationship between age and average total sleep time (ATST). To obtain a measure for ATST (in minutes), recordings were taken on each subject on three consecutive nights and then averaged. Results are provided to you in Sleep&Age.xlsx Download Sleep&Age.xlsx file.
- (2 points) Determine the least-squares regression line for predicting average total sleep time using age.
- (2 points) Make a scatter plot of the data with ATST on the y-axis (vertical axis) and Age on the x-axis (horizontal axis) with least squares regression line overlaid on the top (i.e.: obtain the fitted line plot). Make sure to attach the plot below.
- (7 points) Check the assumptions for the simple linear regression. Attach any plots you used check the assumptions and comment on them.
- (7 points) We want to see if the average sleep time decreases as the children grow older. Write the appropriate null and alternative hypothesis you would formulate to answer this research problem, calculate the test statistic and the p value (show the work for obtaining the p value by writing the probability statement corresponds to the p value for this problem). Based on the p value you obtained, what can you say about the relationship?
- (2 points) What is the correlation between ATST and age?


Trending now
This is a popular solution!

Step by step
Solved in 2 steps

