Average temperature in Winter and Summer in a region for 2016-2019 is given belo Year Winter Summer 2016 20 45 2017 35 44 2018 28 43 2019 29 48 Assume the additive time series model with no trend and using the above data, answ following questions. 1. Compute two period moving averages MA(2). 2. What is the advantage of computing MA(2). 3. Do you need to compute CMA. Why or why not. 4. Estimate the seasonal factors for Winter and summer.
Average temperature in Winter and Summer in a region for 2016-2019 is given belo Year Winter Summer 2016 20 45 2017 35 44 2018 28 43 2019 29 48 Assume the additive time series model with no trend and using the above data, answ following questions. 1. Compute two period moving averages MA(2). 2. What is the advantage of computing MA(2). 3. Do you need to compute CMA. Why or why not. 4. Estimate the seasonal factors for Winter and summer.

Linear Algebra: A Modern Introduction
4th Edition
ISBN:9781285463247
Author:David Poole
Publisher:David Poole
Chapter4: Eigenvalues And Eigenvectors
Section4.6: Applications And The Perron-frobenius Theorem
Problem 25EQ

Related questions
Question
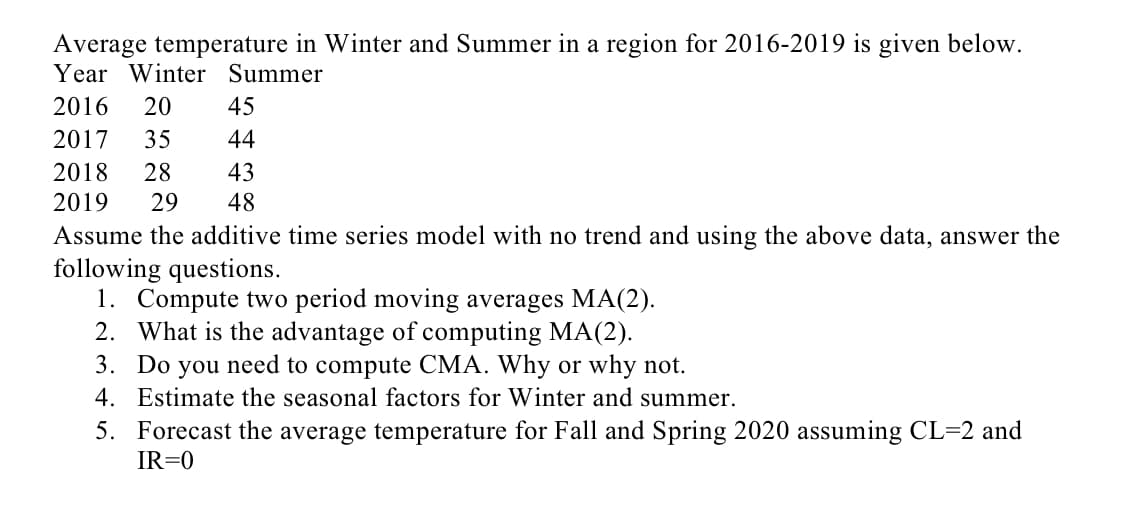
Transcribed Image Text:Average temperature in Winter and Summer in a region for 2016-2019 is given below.
Year Winter Summer
2016
20
45
2017
35
44
2018
28
43
2019
29
48
Assume the additive time series model with no trend and using the above data, answer the
following questions.
1. Compute two period moving averages MA(2).
2. What is the advantage of computing MA(2).
3. Do you need to compute CMA. Why or why not.
4. Estimate the seasonal factors for Winter and summer.
5. Forecast the average temperature for Fall and Spring 2020 assuming CL=2 and
IR=0
Expert Solution
This question has been solved!
Explore an expertly crafted, step-by-step solution for a thorough understanding of key concepts.

Step by step
Solved in 2 steps with 1 images

Knowledge Booster


Learn more about
Need a deep-dive on the concept behind this application? Look no further. Learn more about this topic, statistics and related others by exploring similar questions and additional content below.Recommended textbooks for you
Linear Algebra: A Modern Introduction
Algebra
ISBN:
9781285463247
Author:
David Poole
Publisher:
Cengage Learning

College Algebra
Algebra
ISBN:
9781305115545
Author:
James Stewart, Lothar Redlin, Saleem Watson
Publisher:
Cengage Learning

Glencoe Algebra 1, Student Edition, 9780079039897…
Algebra
ISBN:
9780079039897
Author:
Carter
Publisher:
McGraw Hill
Linear Algebra: A Modern Introduction
Algebra
ISBN:
9781285463247
Author:
David Poole
Publisher:
Cengage Learning
College Algebra
Algebra
ISBN:
9781305115545
Author:
James Stewart, Lothar Redlin, Saleem Watson
Publisher:
Cengage Learning
Glencoe Algebra 1, Student Edition, 9780079039897…
Algebra
ISBN:
9780079039897
Author:
Carter
Publisher:
McGraw Hill