The table below contains the average price paid for a new home in a certain area from 2000 to 2010. a. Construct a time-series plot of new home prices. b. What pattern, if any, is present in the data? Year Average Price S thousands) (puronound a. Construct a time-series plot of new home prices. Choose the correct graph below. O A. O B. 380 300- 220- 140**** 2000 2005 2010 Year Q 2000 351.1 C Price ($ thousands) 380 300- 220- 2001 330.5 140 2000 2005 2010 Year Q Q C 2002 310.5 b. What pattern, if any, is present in the data? OA. Home prices appear to be steady from 2000 to 2004 and increasing from 2004 to 2010. OB. Home prices appear to be decreasing from 2000 to 2006 and steady from 2006 to 2010. OC. Home prices appear to be increasing from 2000 to 2004 and decreasing from 2006 to 2010. OD. There is no pattern present in the data. 2003 296.7 2004 229.7 2005 182.3 2006 154.5 Q Q 2007 156.3 2008 154.7 O C. O D. 380- 380- 300 300- EM L 220- 220-1 140 2000 2005 2010 Year 140-> 2000 2005 2010 Year Q G 2009 154.5 2010 154.5
The table below contains the average price paid for a new home in a certain area from 2000 to 2010. a. Construct a time-series plot of new home prices. b. What pattern, if any, is present in the data? Year Average Price S thousands) (puronound a. Construct a time-series plot of new home prices. Choose the correct graph below. O A. O B. 380 300- 220- 140**** 2000 2005 2010 Year Q 2000 351.1 C Price ($ thousands) 380 300- 220- 2001 330.5 140 2000 2005 2010 Year Q Q C 2002 310.5 b. What pattern, if any, is present in the data? OA. Home prices appear to be steady from 2000 to 2004 and increasing from 2004 to 2010. OB. Home prices appear to be decreasing from 2000 to 2006 and steady from 2006 to 2010. OC. Home prices appear to be increasing from 2000 to 2004 and decreasing from 2006 to 2010. OD. There is no pattern present in the data. 2003 296.7 2004 229.7 2005 182.3 2006 154.5 Q Q 2007 156.3 2008 154.7 O C. O D. 380- 380- 300 300- EM L 220- 220-1 140 2000 2005 2010 Year 140-> 2000 2005 2010 Year Q G 2009 154.5 2010 154.5

MATLAB: An Introduction with Applications
6th Edition
ISBN:9781119256830
Author:Amos Gilat
Publisher:Amos Gilat
Chapter1: Starting With Matlab
Section: Chapter Questions
Problem 1P

Related questions
Question
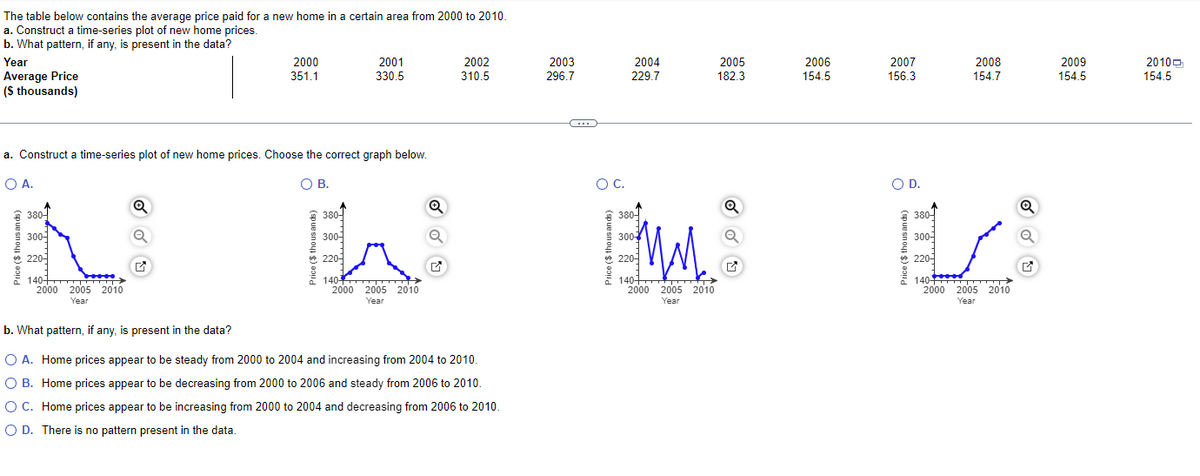
The table below contains the average price paid for a new home in a certain area from 2000 to 2010.
a. Construct a time-series plot of new home prices.
b. What pattern, if any, is present in the data?
Year Average_Price_($_thousands)
2000 351.1
2001 330.5
2002 310.5
2003 296.7
2004 229.7
2005 182.3
2006 154.5
2007 156.3
2008 154.7
2009 154.5
2010 154.5
2000 351.1
2001 330.5
2002 310.5
2003 296.7
2004 229.7
2005 182.3
2006 154.5
2007 156.3
2008 154.7
2009 154.5
2010 154.5
Transcribed Image Text:The table below contains the average price paid for a new home in a certain area from 2000 to 2010.
a. Construct a time-series plot of new home prices.
b. What pattern, if any, is present in the data?
Year
Average Price
($ thousands)
Price ($ thousands)
a. Construct a time-series plot of new home prices. Choose the correct graph below.
O A.
O B.
380-
300-
220-
140 >
2010
2000 2005
Year
זי་
Q
Q
2000
351.1
✔
Price ($ thousands)
2001
330.5
380-
300-
Ⓒ220-
140
2000 2005 2010
Year
Q
2002
310.5
b. What pattern, if any, is present in the data?
O A. Home prices appear to be steady from 2000 to 2004 and increasing from 2004 to 2010.
O B. Home prices appear to be decreasing from 2000 to 2006 and steady from 2006 to 2010.
O C. Home prices appear to be increasing from 2000 to 2004 and decreasing from 2006 to 2010.
O D. There is no pattern present in the data.
2003
296.7
←
O C.
2004
229.7
380-
MM
300+
220-
140+
2000 2005 2010
Year
2005
182.3
Q
Q
2006
154.5
2007
156.3
O D.
Price ($ thousands)
380-
300-
220-
2008
154.7
140TT >
2005 2010
Year
2000
Q
Q
✔
2009
154.5
2010
154.5
Expert Solution
This question has been solved!
Explore an expertly crafted, step-by-step solution for a thorough understanding of key concepts.

Step by step
Solved in 3 steps with 3 images

Recommended textbooks for you
MATLAB: An Introduction with Applications
Statistics
ISBN:
9781119256830
Author:
Amos Gilat
Publisher:
John Wiley & Sons Inc

Probability and Statistics for Engineering and th…
Statistics
ISBN:
9781305251809
Author:
Jay L. Devore
Publisher:
Cengage Learning

Statistics for The Behavioral Sciences (MindTap C…
Statistics
ISBN:
9781305504912
Author:
Frederick J Gravetter, Larry B. Wallnau
Publisher:
Cengage Learning
MATLAB: An Introduction with Applications
Statistics
ISBN:
9781119256830
Author:
Amos Gilat
Publisher:
John Wiley & Sons Inc
Probability and Statistics for Engineering and th…
Statistics
ISBN:
9781305251809
Author:
Jay L. Devore
Publisher:
Cengage Learning
Statistics for The Behavioral Sciences (MindTap C…
Statistics
ISBN:
9781305504912
Author:
Frederick J Gravetter, Larry B. Wallnau
Publisher:
Cengage Learning

Elementary Statistics: Picturing the World (7th E…
Statistics
ISBN:
9780134683416
Author:
Ron Larson, Betsy Farber
Publisher:
PEARSON

The Basic Practice of Statistics
Statistics
ISBN:
9781319042578
Author:
David S. Moore, William I. Notz, Michael A. Fligner
Publisher:
W. H. Freeman

Introduction to the Practice of Statistics
Statistics
ISBN:
9781319013387
Author:
David S. Moore, George P. McCabe, Bruce A. Craig
Publisher:
W. H. Freeman