B, and the remainder on Machine C. 1) What is the probability of producing a defect at the purification step? 2) Given that there is a defect, what is the probability that it was processed on: a) Machine A?
B, and the remainder on Machine C. 1) What is the probability of producing a defect at the purification step? 2) Given that there is a defect, what is the probability that it was processed on: a) Machine A?

Chapter8: Sequences, Series,and Probability
Section8.7: Probability
Problem 11ECP: A manufacturer has determined that a machine averages one faulty unit for every 500 it produces....

Related questions
Question
5,,
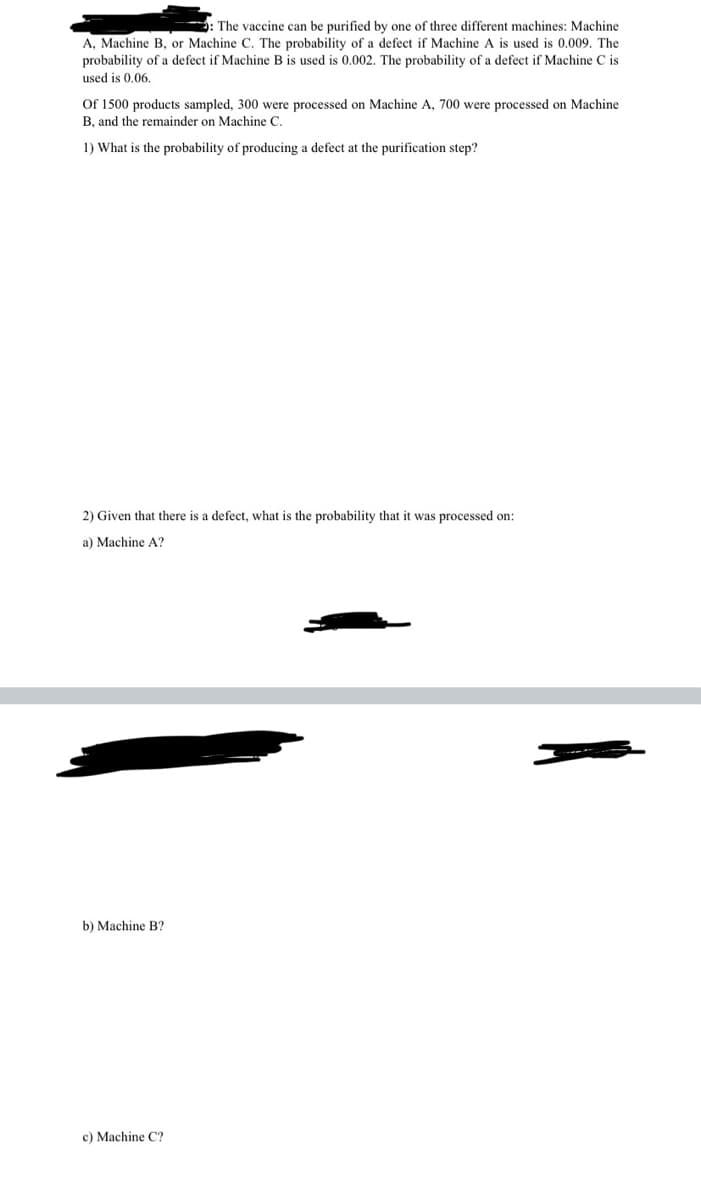
Transcribed Image Text:The vaccine can be purified by one of three different machines: Machine
A, Machine B, or Machine C. The probability of a defect if Machine A is used is 0.009. The
probability of a defect if Machine B is used is 0.002. The probability of a defect if Machine C is
used is 0.06.
Of 1500 products sampled, 300 were processed on Machine A, 700 were processed on Machine
B, and the remainder on Machine C.
1) What is the probability of producing a defect at the purification step?
2) Given that there is a defect, what is the probability that it was processed on:
a) Machine A?
b) Machine B?
c) Machine C?
Expert Solution
This question has been solved!
Explore an expertly crafted, step-by-step solution for a thorough understanding of key concepts.

Step by step
Solved in 3 steps with 3 images

Recommended textbooks for you