(b) Calculate the t-statistics of the coefficient of AADT (b = 0.002) using the following equation: /SSE/(n – 2) VE:(x; – x)² where x, = observed AADT for segment i; x = average observed AADT for all segments. Assess statistical significance of the coefficient b at a 95% confidence interval using hypothetical testing. Assume null hypothesis (Ho): b is not statistically different from zero and alternative hypothesis (H1): b is statistically different from zero. Sketch a t-distribution curve and show 1) the calculated t-statistics; 2) the critical values of t-statistics (tent0.025 = 2.01 for sample size = 48); and 3) the confidence interval in the sketch.
(b) Calculate the t-statistics of the coefficient of AADT (b = 0.002) using the following equation: /SSE/(n – 2) VE:(x; – x)² where x, = observed AADT for segment i; x = average observed AADT for all segments. Assess statistical significance of the coefficient b at a 95% confidence interval using hypothetical testing. Assume null hypothesis (Ho): b is not statistically different from zero and alternative hypothesis (H1): b is statistically different from zero. Sketch a t-distribution curve and show 1) the calculated t-statistics; 2) the critical values of t-statistics (tent0.025 = 2.01 for sample size = 48); and 3) the confidence interval in the sketch.

Linear Algebra: A Modern Introduction
4th Edition
ISBN:9781285463247
Author:David Poole
Publisher:David Poole
Chapter7: Distance And Approximation
Section7.3: Least Squares Approximation
Problem 31EQ

Related questions
Question
plz solve question (b) with explanation within 30-40 mins and get upvotes.
Transcribed Image Text:crash
329
201
263
170
AADT
Question 3 (
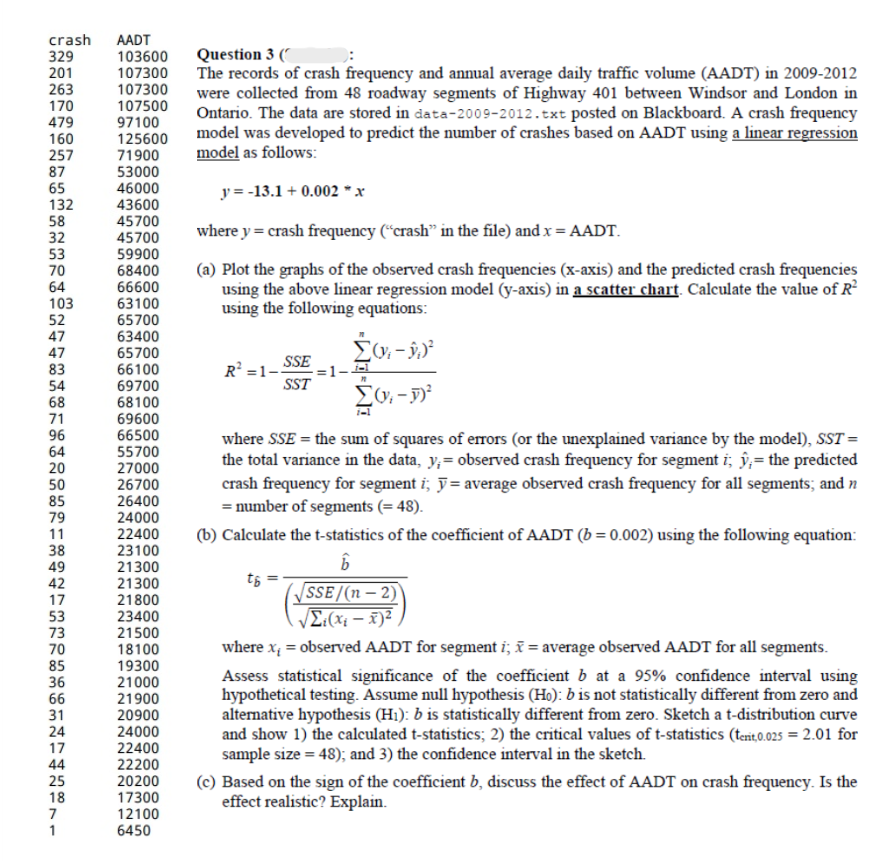
The records of crash frequency and annual average daily traffic volume (AADT) in 2009-2012
were collected from 48 roadway segments of Highway 401 between Windsor and London in
Ontario. The data are stored in data-2009-2012.txt posted on Blackboard. A crash frequency
model was developed to predict the number of crashes based on AADT using a linear regression
model as follows:
103600
107300
107300
107500
97100
125600
71900
53000
46000
43600
479
160
257
87
65
132
58
32
53
70
64
y = -13.1 + 0.002 * x
45700
45700
59900
68400
66600
where y = crash frequency (“crash" in the file) and x = AADT.
(a) Plot the graphs of the observed crash frequencies (x-axis) and the predicted crash frequencies
using the above linear regression model (y-axis) in a scatter chart. Calculate the value of R
using the following equations:
103
52
63100
47
47
65700
63400
65700
83
54
66100
69700
R² =1- SSE
SST
68
71
68100
69600
96
64
20
50
85
79
66500
55700
where SSE = the sum of squares of errors (or the unexplained variance by the model), SST =
the total variance in the data, y,= observed crash frequency for segment i; ŷ,= the predicted
27000
26700
crash frequency for segment i; ỹ= average observed crash frequency for all segments; and n
= number of segments (= 48).
26400
24000
22400
11
(b) Calculate the t-statistics of the coefficient of AADT (b = 0.002) using the following equation:
38
49
23100
21300
42
17
21300
21800
23400
21500
SSE/(n – 2)
E:(xi – x)²
53
73
where x = observed AADT for segment i; x = average observed AADT for all segments.
70
85
36
66
18100
19300
21000
Assess statistical significance of the coefficient b at a 95% confidence interval using
hypothetical testing. Assume null hypothesis (Ho): b is not statistically different from zero and
alternative hypothesis (H1): b is statistically different from zero. Sketch a t-distribution curve
and show 1) the calculated t-statistics; 2) the critical values of t-statistics (tenit,0.025 = 2.01 for
sample size = 48); and 3) the confidence interval in the sketch.
21900
31
24
17
20900
24000
22400
22200
20200
17300
12100
6450
44
25
18
7
(c) Based on the sign of the coefficient b, discuss the effect of AADT on crash frequency. Is the
effect realistic? Explain.
1
Expert Solution
This question has been solved!
Explore an expertly crafted, step-by-step solution for a thorough understanding of key concepts.

This is a popular solution!

Trending now
This is a popular solution!

Step by step
Solved in 4 steps with 4 images

Recommended textbooks for you
Linear Algebra: A Modern Introduction
Algebra
ISBN:
9781285463247
Author:
David Poole
Publisher:
Cengage Learning


Glencoe Algebra 1, Student Edition, 9780079039897…
Algebra
ISBN:
9780079039897
Author:
Carter
Publisher:
McGraw Hill
Linear Algebra: A Modern Introduction
Algebra
ISBN:
9781285463247
Author:
David Poole
Publisher:
Cengage Learning
Glencoe Algebra 1, Student Edition, 9780079039897…
Algebra
ISBN:
9780079039897
Author:
Carter
Publisher:
McGraw Hill