. Which of the two excel outputs above is the correct result of the data? b. What is the appropriate set of hypotheses for this test? c. From the given results above, which test is appropriate to test the significant difference between the heat-producing capacities of the coal from the mines?
. Which of the two excel outputs above is the correct result of the data? b. What is the appropriate set of hypotheses for this test? c. From the given results above, which test is appropriate to test the significant difference between the heat-producing capacities of the coal from the mines?

Glencoe Algebra 1, Student Edition, 9780079039897, 0079039898, 2018
18th Edition
ISBN:9780079039897
Author:Carter
Publisher:Carter
Chapter10: Statistics
Section10.1: Measures Of Center
Problem 9PPS

Related questions
Question
a. Which of the two excel outputs above is the correct result of the data?
b. What is the appropriate set of hypotheses for this test?
c. From the given results above, which test is appropriate to test the significant difference between the heat-producing capacities of the coal from the mines?
d. What is the t- critical value?
e. What is the p-value?
f. At α=0.05, what is the correct decision?
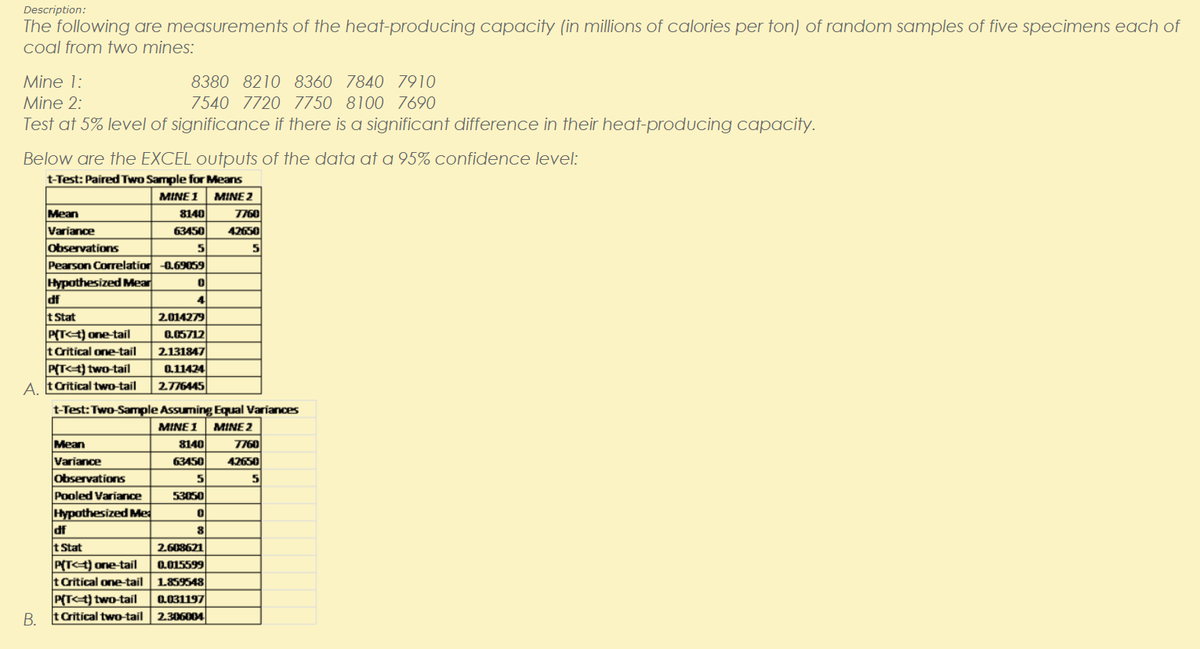
Transcribed Image Text:Description:
The following are measurements of the heat-producing capacity (in millions of calories per fon) of random samples of five specimens each of
coal from two mines:
Mine 1:
8380 8210 8360 7840 7910
Mine 2:
7540 7720 7750 8100 7690
Test at 5% level of significance if there is a significant difference in their heat-producing capacity.
Below are the EXCEL outputs of the data at a 95% confidence level:
t-Test: Paired Two Sample for Means
MINE 1 | MINЕ 2
T760
42650
5
Mean
8140
Variance
Observations
Pearson Correlatior -0.69059
63450
5
Hypothesized Mear
df
t Stat
4
2014279
P(T4) one-tail
tritical one-tail
0.05712
2131847
P(T<t) two-tail
A tcritical two-tail
0.11424
2776445
t-Test:Two-Sample Assuming Equal Variances
MINE1 MINE 2
8140
Mean
T760
42650
5
Variance
63450
Observations
5
Pooled Variance
53050
Hypothesized Me
df
t Stat
2.608621
P(T4) one-tail
tCritical one-tail 1859548
P(T<t} two-tail
B tritical two-tail 2306004
0.015599
0.031197
В.
Expert Solution
This question has been solved!
Explore an expertly crafted, step-by-step solution for a thorough understanding of key concepts.

Step by step
Solved in 5 steps with 2 images

Recommended textbooks for you
Glencoe Algebra 1, Student Edition, 9780079039897…
Algebra
ISBN:
9780079039897
Author:
Carter
Publisher:
McGraw Hill
Glencoe Algebra 1, Student Edition, 9780079039897…
Algebra
ISBN:
9780079039897
Author:
Carter
Publisher:
McGraw Hill