
Glencoe Algebra 1, Student Edition, 9780079039897, 0079039898, 2018
18th Edition
ISBN:9780079039897
Author:Carter
Publisher:Carter
Chapter10: Statistics
Section10.6: Summarizing Categorical Data
Problem 4AGP

Related questions
Question
I need answer within 5 minutes please please with my best wishes
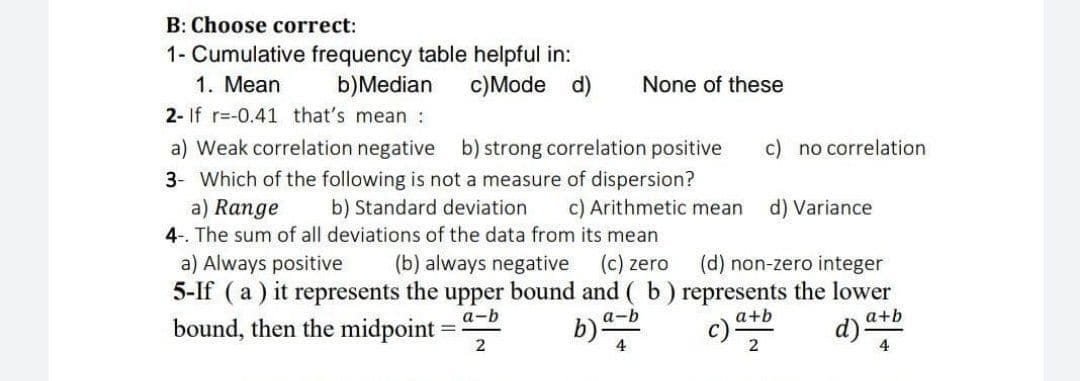
Transcribed Image Text:B: Choose correct:
1- Cumulative frequency table helpful in:
b)Median
1. Mean
c)Mode d)
None of these
2- If r=-0.41 that's mean :
a) Weak correlation negative b) strong correlation positive
c) no correlation
3- Which of the following is not a measure of dispersion?
a) Range
4-. The sum of all deviations of the data from its mean
a) Always positive
5-If (a ) it represents the upper bound and ( b ) represents the lower
bound, then the midpoint =
b) Standard deviation
c) Arithmetic mean
d) Variance
(b) always negative
(c) zero
(d) non-zero integer
а-b
a-b
a+b
a+b
b)
d)-
4
4
Expert Solution
This question has been solved!
Explore an expertly crafted, step-by-step solution for a thorough understanding of key concepts.

Step by step
Solved in 3 steps with 3 images

Recommended textbooks for you
Glencoe Algebra 1, Student Edition, 9780079039897…
Algebra
ISBN:
9780079039897
Author:
Carter
Publisher:
McGraw Hill
Glencoe Algebra 1, Student Edition, 9780079039897…
Algebra
ISBN:
9780079039897
Author:
Carter
Publisher:
McGraw Hill