Use the following frequency distribution table of exam scores of students in section A to answer :(questions (i-ii frequency Score 14-16 16-18
Use the following frequency distribution table of exam scores of students in section A to answer :(questions (i-ii frequency Score 14-16 16-18

Glencoe Algebra 1, Student Edition, 9780079039897, 0079039898, 2018
18th Edition
ISBN:9780079039897
Author:Carter
Publisher:Carter
Chapter10: Statistics
Section10.6: Summarizing Categorical Data
Problem 4AGP

Related questions
Question
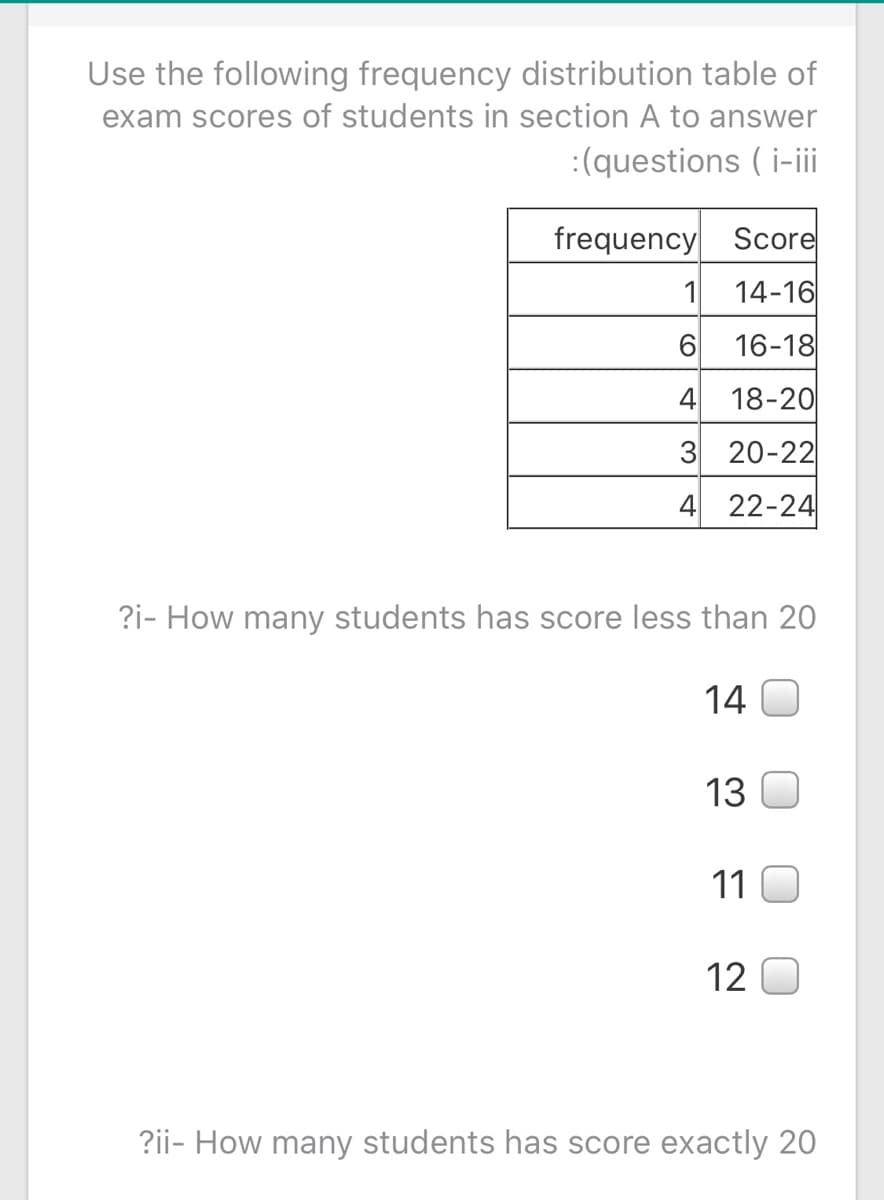
Transcribed Image Text:Use the following frequency distribution table of
exam scores of students in section A to answer
:(questions ( i-ii
frequency Score
1
14-16
6.
16-18
4
18-20
3 20-22
4
22-24
?i- How many students has score less than 20
14
13
11
12
?ii- How many students has score exactly 20
Expert Solution
This question has been solved!
Explore an expertly crafted, step-by-step solution for a thorough understanding of key concepts.

Step by step
Solved in 2 steps

Knowledge Booster


Learn more about
Need a deep-dive on the concept behind this application? Look no further. Learn more about this topic, statistics and related others by exploring similar questions and additional content below.Recommended textbooks for you
Glencoe Algebra 1, Student Edition, 9780079039897…
Algebra
ISBN:
9780079039897
Author:
Carter
Publisher:
McGraw Hill
Glencoe Algebra 1, Student Edition, 9780079039897…
Algebra
ISBN:
9780079039897
Author:
Carter
Publisher:
McGraw Hill