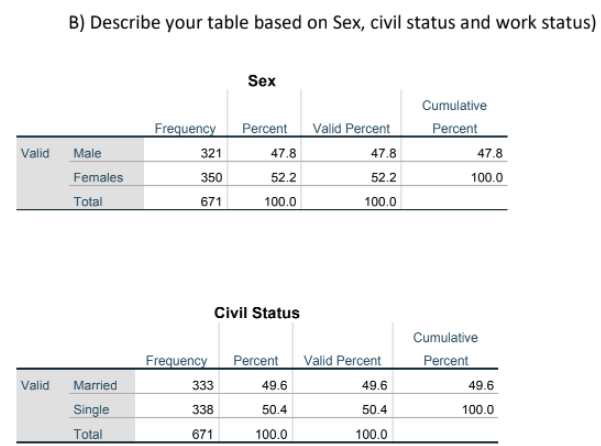
B) Describe your table based on Sex, civil status and work status) Sex Cumulative Frequency Percent Valid Percent Percent Valid Male 321 47.8 47.8 47.8 Females 350 52.2 52.2 100.0 Total 671 100.0 100.0 Civil Status Cumulative Frequency Percent Valid Percent Percent Valid Married 333 49.6 49.6 49.6 Single 338 50.4 50.4 100.0 Total 671 100.0 100.0


Q: IQ tests were carried out to find the relationship between age and IQ. A group of 10 people ranging…
A: Let X- age, Y-IQ
Q: 1. As studied, the average number of hours spent by senior high school students for their online…
A: The random variable X follows normal distribution. We have to find the probabilities for the given…
Q: 2. The scores on a nationwide aptitude examination for Science and Technology are normally…
A: Given that, scores on a nationwide aptitude examination for Science and Technology are normally…
Q: The concentration of a certain active agent in a liquid form of a pesticide must not exceed 12 parts…
A: Since it is not mentioned which question to be answered, we'll be answering the first question only.…
Q: The weights of 40 pupils are shown below 35 43 52 39 62 54 58 37 44 62 43 48 53 42 55 37 45 50 40 46…
A: Given that -
Q: A box contains 20 chocolates. 5 of the chocolates are black chocolate flavour while the balances are…
A:
Q: At a certain restaurant , there is a 60% probability that the candles on your table will be red . If…
A: Binomial pmf has used.
Q: Consider a confidence interval, with confidence coefficient 1- a, for the mean of a normal…
A: here AS PER GUIDELINES I HAVE CALCULATED FIRST MAIN QUESTION , AS YOU POSTED SECOND QUESTION WHICH…
Q: 2. a) A pair of dice is thrown. Find the probability that sum of the points on the two dice is 10 or…
A:
Q: (a) A random variable X is defined as the larger of the scores obtained in two throws of an…
A: We need to show that, P(X=x) = (2x-1)36
Q: 2. Marks in MATHO01(X): 4. 4. 6. Marks in STAT101 (Y): 3. 4. 4. (a)Estimate the simple linear…
A:
Q: If, in a (two-tail) hypothesis test, the p-value is 0.0803, what is your statistical decision if you…
A: Given P value=0.0803 Alpha=0.03
Q: As practiced by many in buying skirts or pants, they use the neckline to check if the waistline of…
A:
Q: What is the relationship between the number of minutes per day a woman spends talking on the phone…
A: Given the number of minutes per day a woman spends talking on the phone and the woman's weight.
Q: QUESTION 19 Results that are significant indicate that the data has proven your hypothesis. True O…
A: According to the given information in this question We need to identify the correct option
Q: how many of the 1,200 participants finish the race within 36.5 minutes and better
A: We have given that Mean, μ = 58.4 Standard deviation, σ = 7.3 Sample size, n = 1200 Z-Score, z = (…
Q: Suppose that you draw a random sample from a population where you know the population mean is 36 and…
A:
Q: 1-60 drinks More than 60 drinks ks per month Total per month per month 100 30 150 400 150 650 25 15…
A: According to guidelines we solve first three subparts when given multiple subparts.
Q: In a survey of 500 human resource professionals, 70% said that the appearance of a resume is very…
A: Use simple formula
Q: Use a pivot table to construct a frequency distribution and histogram of lunch sales amounts for the…
A: Date Day Lunch Dinner Delivery 01-Apr Saturday 595 1406 911 02-Apr Sunday 938 1270 526 04-Apr…
Q: this is not correct
A: Correlation is used to measure the mean significance between the two numerical variable. If two…
Q: The table presents gasoline mileage performance for 25 automobiles (Source: Motor Trend, 1975). X6 Y…
A: Solution: Let A denote by 1 and M denoted by 0. From the given information,
Q: Three cards are chosen without replacement from a deck of 52 cards and placed in order from first to…
A:
Q: Assume S = $45, σ = 0.25, r = 0.05, div = 0.0, on a 45 strike call and 55 days until expiration.…
A:
Q: Consider the random process X(t) = Acos (@,t +0), where A and w, are real constants and 0 is a…
A:
Q: a. Fit a linear trend curve by the least-squares method to the following data and determine…
A: Given that - a) Year 2011 2012 2013 2014 2015 2016 2017 2018 2019 2020…
Q: in order to evaluate the diagnostic accuracy of new rapid test for COVID-19 results of the screening…
A: False positive rate is a measure of accuracy of a test. It is basically a probability of falsely…
Q: The table below shows the examination results of 100 students as a percentage Exam Result (%)…
A: Since you have posted a question with multiple sub-parts, we will solve first 3 sub-parts for you.…
Q: 19. If X1 and X, are Poisson vaiates with means m¡ and m2 prove that the probability that x1 – x2…
A:
Q: nfidence interval for the average net change in a student's score after completing the course.…
A: We have given that, The data set are : 12, 11, 15, 14, 22 Then, We will find the 80% confidence…
Q: The lifetimes of projector bulbs of a particular type are normally distributed with a mean of 470…
A:
Q: D e t e r mi n e a.) t h e s a m pl e s i z e i f 5% ma r g i n o f e r ro r ( b. )…
A: here given , MOE = 5% N = population = 230 + 130 + 95 + 25 + 10 = 490
Q: A multiple-choice quiz has 6 questions and5 possible answers per question. How many different ways…
A: We have given that Number of multiple choice questions = 6 Each question has number of possible…
Q: A study was done using a treatment group and a placebo group. The results are shown in the table.…
A: Given Information: No. of samples=02In Treatment, nT=34xT=2.39sT=0.62In Placebo, nP=31xP=2.68sP=0.98…
Q: A study discovered that Americans consumed an average of 13.2 pounds of chocolate per year. Assume…
A: Let X denote the annual chocolate consumption follows the normal distribution. (a) The probability…
Q: Item Expenditure (Rs.) Food 240 The adjoining table gives the break-up of Clothing 66 the…
A:
Q: Question All maximum possible random samples of size 4 are drawn from the finite population…
A: Given that, Populations are 2,4 Population mean and standard deviation are calculated as follows:…
Q: I know how to do the first part, I am curious how to get the 95% confidence interval on part 6.
A:
Q: following would be an appropriate null hypothesis? A. The mean age of a sample is equal to 30. B.…
A:
Q: Times for a surgical procedure are normally distributed. There are two methods. Method A has a mean…
A:
Q: 3. A manufacturer of paper used for making grocery bags is interested in improving the tensile…
A: There are 4 independent samples which are 4 types of hardwood concentrations. We have to test…
Q: Let x indicate the number of pairs of shoes produced. Develop a mathematical model for the total…
A: The O'Neill Shoe Manufacturing Company will produce a special-style shoe if the order size is large…
Q: The average price of a personal computer (PC) is $987. If the computer prices are approximately…
A: Given information Population mean µ = $987 Variance σ2 = $8078 So, standard deviation σ = $89.878 We…
Q: The data shows that the percentage of female cigarette smokers in a certain country declined from…
A: The regression equation is f = -0.40t + 22.24, where f is the percentage of female smokers and t is…
Q: ase in statistics ter
A: Sex N Mean Std. Dev Std. Error Mean Sleep hours/weeknights Male 321 7.5749 1.42558 0.07957…
Q: List two ways to identify a simple random sample.
A: Definition: Simple random sampling is defined as a sampling technique where every item in the…
Q: OTHER Zodlogts are sting wehs of captive timer wolves in three counties IN United State, tngand, and…
A: a) k=3, df=24 Critical value q = 3.41 number of intervals required = KC2= 3
Q: 1. In the first semester of the year 2003, the average return for a group of 251 investing companies…
A: From the provided information, Mean (µ) = 4.5% Standard deviation (σ) = 1.5% Sample size (n) = 40…
Q: Nhat is the company's expected value for each warranty sold?
A: HERE USE GIVEN INFORMATION AND EXPECTED VALUE FORMULA
Q: The psd of X(t) is given by [1+ @? for | @|<1 Sxx (@) otherwise Find the autocorrelation function.
A:
please describe the tables statistically
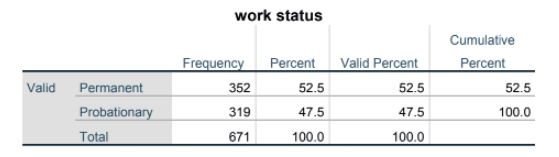

Step by step
Solved in 2 steps

- According to the Department of Motor Vehicles (DMV), the entity in charge ofprovidingdrivinglicensesintheUnitedStates,itisillegaltodrivewithabloodalcoholcontentof0.08%ormoreif you are 21 or older. In the DMV’s guidelines to determine when a person is driving under the influence, itisindicatedthatfewer than five percent of the population weighing 100 pounds will exceed the 0.33 alcohol level. Assume this is accurate. If the Highway Patrol stops in a random day 200 unrelated cars where the individual weighs one hundred pounds, on a Friday night, what is the probability that six percent of more individuals stopped exceeds that 0.33 alcohol level?The Los Angeles City Controller's office calculated that in 2013, the city employed 4703047030 full‑time employees and 1014210142 part‑time employees. Assume that an outside advocacy group had been lobbying the Mayor's office to convert part‑time workers into full‑time workers throughout 2014. The Controller's office makes its calculations annually. Suppose that the outside advocacy group wanted to know the proportion of city employees (excluding per‑event employees) who are full‑time employees ?p in June 2014 to gauge if their lobbying efforts had been effective. Suppose that the group surveyed a random sample of 1000 city employees (excluding per‑event employees) in June 2014 and found that 845845 were full‑time employees and 155155 were part‑time employees. If the advocacy group planned to use a one‑sample z-z-test for a proportion to test their lobbying eforts, the appropriate null hypothesis would be and the appropriate alternative hypothesis would be Assume…According to the Pew Research Center,on the propotion of the American population who use only a cellular telephone (landline) is 0.37. Jason conducts a survey of one hundred fifty 20 to 24 year olds who live on their own and finds that 73 do not have a landline to their home. Does this provide sufficient evidence to conclude that the proportion of 20 to 24 year olds who live on their own and don't have a landline is greater than 0.37? Use a=0.10 level of significance. A) Verify that nP0(1-P0)>10 and n< 0.05N (Assume the population sizes is N=40 million) B) State the appropiate null and alternative hypotheses. C) Indicate whether the hypothesis is left, right, or two- tailed.
- According to the Pew Research Center,on the propotion of the American population who use only a cellular telephone (landline) is 0.37. Jason conducts a survey of one hundred fifty 20 to 24 year olds who live on their own and finds that 73 do not have a landline to their home. Does this provide sufficient evidence to conclude that the proportion of 20 to 24 year olds who live on their own and don't have a landline is greater than 0.37? Use a=0.10 level of significance. D) Compute the test statistic z0. Round to the nearest hundredth. E) Draw a normal model with the area that represents the P-value shaded. F) Determine and interpret the P-value. What is the conclusion of the hypothesis test?Following is a list of 21 African nations for which information is available on voter turnout (percentage of the voting age population) for president between 2005 and 2008. Compute and interpret the median and mean percentage turnout. TABLE 3.6 Presidential Voter Turnout, 21 African Countries, 2005–2008Country Year % Turnout VAPBurkina Faso 2005 36.4Cape Verde 2006 78.59Central African Republic 2005 45.14Chad 2006 71.4Comoros 2006 52.14Djibouti 2005 67.82Egypt 2005 16.41Gabon 2005 51.47Gambia 2006 50.66Guinea-Bissau 2005 66.84Kenya 2007 54.49Liberia 2005 59.01Madagascar 2006 50.85Mali 2007 48.18Mauritania 2007 53.55São Tomé and Príncipe 2006 69.76Senegal 2007 55.11Seychelles 2006 97.08Sierra Leone 2007 62.02Zambia 2008 34.18Zimbabwe 2008 47.27The following is a sample of 19 November utility bills (in dollars) from a neighborhood.What is the largest bill in the sample that would not be considered an outlier?52, 62, 66, 68, 72, 74, 76, 76, 76, 78, 78, 82, 84, 84, 86, 88, 90, 108, 110
- Following is a list of 21 African nations for which information is available on voter turnout (percentage of the voting age population) for president between 2005 and 2008. Compute and interpret the median and mean percentage turnout. Presidential Voter Turnout, 21 African Countries, 2005–2008 COUNTRY YEAR % Turnout VAP Burkina Faso 2005 36.4 Cape Verde 2006 78.59 Central African Rep. 2005 45.14 Chad 2006 71.4 Comoros 2006 52.14 Djibouti 2005 67.82 Egypt 2005 16.41 Gabon…A conservative radio talk show host with a large audience is interested in the proportion p ofadults in his listening area who think the drinking age should be lowered to eighteen. To findthis out, he poses the following question to his listeners: “Do you think that the drinking ageshould be reduced to eighteen in light of the fact that eighteen year‐olds are eligible for militaryservice?” He asks listeners to phone in and vote “Yes” if they agree the drinking age should belowered and “No” if not. Of the 100 people who phoned in, 70 answered “Yes.” a. List one source of sampling bias (i.e. bias based on the people included in the sample). b. List another source of bias (sampling or non-sampling).Of the 200 randomly selected local fishers, 28 are solely fishing as income source and 172 have alternative or supplemental livelihood such as getting employed as a construction worker, farmer, carpenter, motorcycle/tricycle driver, selling/vending souvenir and other products, or working in a passenger boat batil or tripolante (i.e., captain or crew). Their estimated monthly income (in PhP) are shown below. Using α = 0.05, is there a significant difference in the monthly income of fishers whose sole livelihood is fishing compared to those with alternative/supplemental income sources? Assume that the fishers income is normally distributed a) Analyze manually b) Analyse using SPSS
- The Russel Reynold Association surveyed retired senior executives who had returned to work. They found that after returning to work, 38% were employed by another organization, 32% were self-employed, 23% were either freelancing or consulting, and 7% had formed their own companies. To see if these percentages are consistent with those of Allegheny County residents, a local researcher surveyed 300 retired executives who had returned to work and found that 122 were working for another company, 85 were self-employed, 76 were either freelancing or consulting, and 17 had formed their own companies. State the null and alternative hypothesis and identify the claim, at α=0.10 to test the claim that the percentages are the same for those people in Allegheny Country.And a pool, 102 of 1020 randomly selected adults age 18 or older stated that they believe there is too little spending of national defense. Obtain a point estimate for the proportion of adults age 18 or older who filled there is too little spending on national defense.The American Association of Individual Investors (AAII) conducts a weekly survey of its members to measure the percent who are bullish, bearish, and neutral on the stock market for the next six months. For the week ending March 27, 2019, the survey results showed 33.2% bullish, 39.6% neutral, and 27.2% bearish. Assume these results are based on a sample of 300 AAII members.