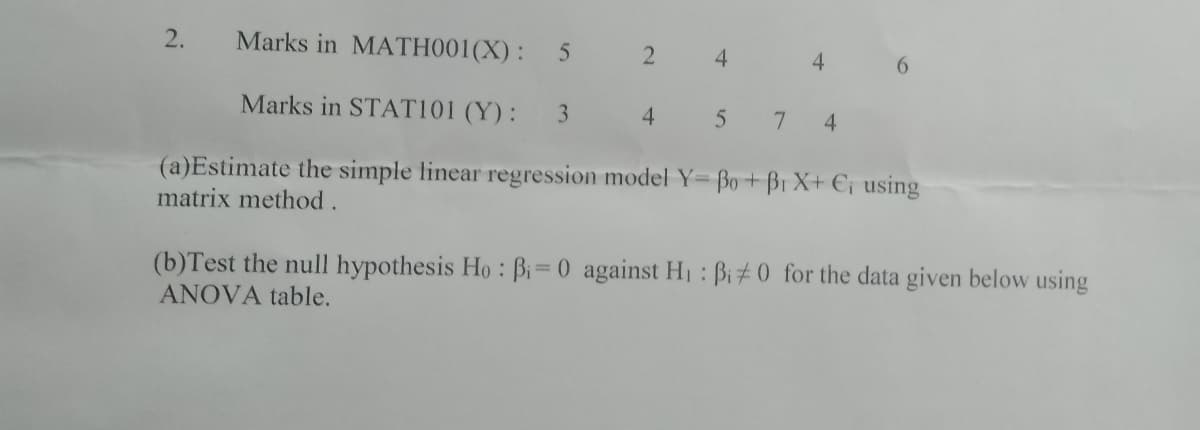
2. Marks in MATHO01(X): 4. 4. 6. Marks in STAT101 (Y): 3. 4. 4. (a)Estimate the simple linear regression model Y= Bo+Br X+ Ej using matrix method. (b)Test the null hypothesis Ho: Bi 0 against H : Bi 0 for the data given below using ANOVA table. %3D


Q: A certain type of cabbage has a mass M which is normally distributed with mean 900 g and standard…
A: Given distribution is normally distributed with mean 900 and standard deviation 100 X~N(μ=900,σ=100)…
Q: A geography test was given to a simple random sample of 500 high-school students in a certain large…
A: Given information: A geography test was given to a simple random sample of 500 high-school students…
Q: How can I calculate the from that because the question asks to round up the number? A population…
A: Given that A population is known to have a right-skewed distributions with mean 10, median 6.931,…
Q: What type of sampling is done when the math department surveys all students in each of 3 sections of…
A:
Q: he table shows data on the number of visitors to the Malaysia in a month, v (1000s), and the amount…
A: Since you have posted a question with multiple subparts, we will solve first three subparts for you.…
Q: 15. Find S.D. from the following data. Values 5 10 15 20 25 30 35 Frequency 2 7 11 15 10 4 1
A: For a set of n observations, x1, x2, ... , xn with frequencies f1, f2, … , fn, standard deviation is…
Q: What is the probability that when a coin is flipped eight times in a row, it lands heads up every…
A: Given,: A coin is tossed 8 times with probability of head p(H)=1/2 Then what is the probability…
Q: According to Census data, in 1960 the population of the U.S amounted to 151.3 million persons, and…
A: Given Information: Consider the data: In 1960: n1=151.3 million p1=0.134 In 2000: n2=281.4…
Q: primer paint can be used on aluminum panels. The primer's drying time is an important consideration…
A: The objective is to test whether the mean drying time of the primer exceeds 1.5 hours using Wilcoxon…
Q: Based on this histogram, the numerical kurtosis value for average handle time is most likely 25 50…
A:
Q: What is the probability that a five-card poker hand contains exactly two aces?
A: There are 52 cards in the standard deck and 4 aces.
Q: A manufacturer receives a certain component from a supplier in shipments of 100 units. Two units in…
A: given that, A manufacturer receives a certain component from a supplier in shipments of 100 units.…
Q: 3. The data in Table 3.1 are from an investigation of an outbreak of severe abdominal pain,…
A: Given Information: Consider the given data: ID Age BLL Log BLL 1 3 69 1.838849 2 4 45…
Q: Vanessa wishes to determine the extent of relationship between a person's systolic blood pressure…
A:
Q: 12, and sample size is 7. For more than one gadget: The mean is 79, standard deviation is 13, and…
A:
Q: For the periods 2014 to 2019, ESKOM’s electricity percentage price adjustments are given in the…
A: From the provided information, The data values are 7.05%, 31.70%, 8.18%, 1.62% and 2.82% Number of…
Q: A data set consists of 101 numbers. How is the median found? O it is the 50th number in a sorted…
A:
Q: 3. The data in Table 3.1 are from an investigation of an outbreak persistent vomiting, and…
A: Age BLL Log BLL 1 3 69 1.838849 2 4 45 1.653213 3 6 49 1.690196 4 7 84 1.924279 5 9 48…
Q: A large sample of children was followed over time. One investigator looked at all the children who…
A: Percentile: Percentile is the percentage of data values that lies below a particular data value.…
Q: H. Find the slope and y-intercept of each regression line. Then, determine if the correlation…
A: The objective is to find the slope, y-intercept, and the kind of correlation in the given regression…
Q: P(x) 0.15 0.35 0.40 10 0.10 x368
A: Solution-: We have given the following table: X P(X) 3 0.15 6 0.35 8 0.4 10 0.1 We…
Q: Q3): In a factory for the production of pre-cast beams, which have different lengths as shown in…
A: A frequency distribution is a tabular, listed or graphical representation of data that shows the…
Q: QUESTION 3 Fill in the blanks below: The pioneering statistical phylogeneticist, Dr. Joe…
A: Answer to the blanks are below. 1.........reliability 2.......indicators 3.......dataset The…
Q: Fill in the missing values in the ANOVA tables below and answer the questions relating to each table…
A: Since you have posted a question with multiple subparts, we will solve first three subparts for you.…
Q: Part 2 of 2 Find the interquartile range. Round your answer to one decimal place as needed. IQR
A:
Q: A six sided die is rolled. What is the probability that the number on top is at least 2? O 1/6 O 2/6…
A:
Q: Cal Bender and Becky Addison have known each other since high school. Two years ago they entered the…
A:
Q: For a standardized psychology examination intended for psychology majors, the historical data show…
A: Given n=40 Standard deviations=175 Mean=500 X-bar=526
Q: A school superintendent wants to know the effects of a four week anti-bullying course on high school…
A:
Q: Suppose that X1, X2,...,Xn represent a random sample from a normal distribution with mean, µand a…
A:
Q: The correct answer for Ho and Ha is Ho: mean greater than or = to 32 Ha; mean is less than 32…
A: here use given Information to perform Hypothesis Testing
Q: Q3): shown in table below: In a factory for the production of pre-cast beams, which have different…
A: We should find the frequency distribution table and draw the histogram for the given data.
Q: distribution with mean, 0 and variance, ø and K1 ,K2 ,...,K17 having a chi-square distribution with…
A:
Q: Which is an example of a binomial experiment? tossing a coin 100 times asking 100 people who they…
A:
Q: Explain in detail the approach of Weighted Least Square used by applied economists to address…
A: Solution: Here, it is needed to explain about the weighted least squares method.
Q: 2. The following data shows the height function of a hill a a distance x from a reference. Form a…
A: Data is given for x and h We have to calculate cubic equation and standard deviation for mentioned…
Q: True or false Boxplots can be used to see the distributions of all the variables in a data set.
A: Box plots is one of the many graphical representations used by statisticians to study the…
Q: Test the hypothesis that the average length of movies made by company 2 exceeds the average length…
A: The provided information is Company 1…
Q: A common knowledge in terms of the time it takes for vocational students to accomplish a special…
A: The provided information is n=20x¯=28.7 minutess=6.7 miniutesµ=30.6 minutesα=0.05The null and…
Q: Which would you expect to have a negative relationship? age of a child and height of the child age…
A:
Q: The owner of a chain fruit shake store would like to study the correlation between atmospheric…
A: Use EXCEL to construct the scatter plot EXCEL procedure: Go to EXCEL Go to Insert menu Select the…
Q: use p-value and z-test for hypotheses testing currently, the fastest rat killer chemical (chemical…
A:
Q: What does the graph tell us with regard to the researchers' question?
A: This graph indicates that people with TBI have, on average different patterns of cognition declines…
Q: best test of the simple hypothesis Ho : 01 = 0 = 0, 02 = 02 = 1 against the ive simple hypothesis H1…
A:
Q: 3. Twe procewo A and 8, were ued to proaduce stainless steel shafts in an industrial company.…
A:
Q: Scenario: Is there a relationship between amount of time at a job (X) and productivity (Y)? The…
A: Four types of measurement levels: Nominal level: It consists of only categories in which the data…
Q: 11. The manager of a rent-a-car business want to know whether the true average numbers of cars…
A: We have given that, Population mean (μ) = 25, population standard deviation (σ) = 6.9, sample size…
Q: An economist uses the regression model Inflation = f(unemployment) to test the Phillips Curve theory…
A: The slope value of the regression equation tells that, in which direction the two variable…
Q: A university dean wishes to estimate the average number of hours his part-time instructor teaches…
A:
Q: The difference between statistical significance and practical significance is that... A.…
A: The difference between statistical significance and practical significance is - Statistical…

Step by step
Solved in 2 steps with 2 images

- The following fictitious table shows kryptonite price, in dollar per gram, t years after 2006. t= Years since 2006 0 1 2 3 4 5 6 7 8 9 10 K= Price 56 51 50 55 58 52 45 43 44 48 51 Make a quartic model of these data. Round the regression parameters to two decimal places.In an instrumental variable regression model with one regressor, Xi, andone instrument, Zi, the regression of Xi onto Zi has R2 = 0.1 and n = 50.Is Zi a strong instrument? Would your answer change if R2 = 0.1 and n = 150?Consider the following simple linear regression model: y = β0 + β1x + u. Using a sample of n observations on x and y, you estimate the model by OLS and obtain the estimates βˆ 0, βˆ 1, and the R-squared of the regression, R2 . Then you scale this sample by a factor of 100, obtain a new sample {xi/100; yi/100} for i = 1, . . . , n, re-estimate the model by OLS, and denote the new coefficient estimates by β˜ 0, β˜ 1, and the new R-squared of the regression by R˜2 . a) Give the expression of β˜ 1 in terms of βˆ 1, and justify your answer.
- 1. Suppose that the sales of a company (Y) is regressed on advertising expenditure (x) and labor cost (z), and the estimated regression equation is Y = 5 + 0.5x + 0.7z + u (where u is the error term). Here, sales, advertising expenditure and labor cost are measured in million Tk. Standard error for the coefficient of x is 0.4, standard error for the coefficient of z is 0.01, and the sample size is 20. Based on this information, find out whether labor cost is a statistically significant variable using an appropriate statistical test.The table below shows the number of state-registered automatic weapons and the murder rate for several Northwestern states, where xx is thousands of automatic weapons and yy is murders per 100,000 residents. xx 11.5 8.5 6.7 3.5 2.9 2.7 2.7 0.9 yy 14.1 11 10 7.3 6.7 6.4 6.4 4.7 Use your calculator to determine the equation of the regression line and write it in the y=ax+by=ax+b form. Round to 2 decimal places. According to this model, how many murders per 100,000 residents can be expected in a state with 10.2 thousand automatic weapons? Round to 3 decimal places. According to this model, how many murders per 100,000 residents can be expected in a state with 5.8 thousand automatic weapons? Round to 3 decimal places.Suppose we want to predict job performance of mechanics based on mechanical aptitude test scores and test scores from personality test that measures conscientiousness. (a) Determine the regression equation. (b) Determine the SSE. Y X1 X2 1 40 25 2 45 20 1 38 30 3 50 30 2 48 28 3 55 30 3 53 34 4 55 36 4 58 32 3 40 34 5 55 38 3 48 28 3 45 30 2 55 36 4 60 34 5 60 38 5 60 42 5 65 38 4 50 34 3 58 38 Where Y is the Performance of the mechanics, X1 is the mechanical aptitude test and X2 is the personality test score that measure conscientiousness.
- A “Cobb–Douglas” production function relates production (Q) to factorsof production, capital (K), labor (L), and raw materials (M), and an errorterm u using the equation Q = λKβ1Lβ2Mβ3eu, where λ, β1, β2, and β3 areproduction parameters. Suppose that you have data on production and thefactors of production from a random sample of firms with the same Cobb–Douglas production function. How would you use regression analysis toestimate the production parameters?Consider the following population linear regression model of individual food expenditure: Y = 50 + 0.5X + u, where Y is weekly food expenditure in dollars, X is the individual’s age, and 50+0.5X is the population regression line. Suppose we generate artificial data for 3 individuals using this model. This artificial sample, which consists of 3 observations, is shown in the following table: Answer the following questions. Show your working. (a) What are the values of V1 and V4? (b) Suppose we know that in this artificial sample, the sample covariance between X and Y is 150, and the sample variance of X is 100. Compute the OLS regression line of the regression of Y on X. (Hint: Assume these summary statistics and the OLS regression line continue to hold in parts (c)-(e).) (c) What are the values of V5 and V7?The estimated regression equation for a model involvingtwo independent variables and 55 observations is: y-hat = 55.17 + 1.1X1 - 0.153X2 Other statistics produced for analysis include: SSR = 12370.8 SST = 35963.0 Sb1 = 0.33 Sb2 = 0.20 a) Interpret b1 and b2 in this estimated regression equation b. Predict y when X1 = 55 and X2 = 70. b) Compute R-square and Adjusted R-Square. e. Compute MSR and MSE. f. Compute F and use it to test whether the overall model is significant using a p-value (α = 0.05). g. Perform a t test using the critical value approach for thesignificance of β1. Use a level of significance of 0.05. h. Perform a t test using the critical value approach for thesignificance of β2. Use a level of significance of 0.05.
- 1) Calculate the two regression equations of X on Y and Y on X from the data given below, taking deviations from a actual means of X and Y.PRICE (Rs.) 10 12 13 12 16 15AMOUNT DEMANDED40 38 43 45 37 43Estimate the likely demand when the price is Rs.20. 2) Which of these numbers cannot be a probability and why?a) -0.00001b) 0.5c) 1.001d) 0e) 1f) 20% 3) In a laboratory experiment on correlation research study the equation of the two regression lines were found to be 2X–Y+1=0 and 3X–2Y+7=0 . Find the means of X and Y. Also work out the values of the regression coefficient and correlation between the two variables X and Y. 4) A die is rolled and a coin is tossed, find the probability that the die shows an odd number and the coin shows a head. 5) Five pairs of observations the following results are obtained ∑X=15, ∑Y=25, ∑X2 =55, ∑Y2 =135, ∑XY=83 Find the equation of the lines of regression and estimate the value of X on the first line when Y=12 and value of Y on the second line if X=8. 6)…A. Identify the regression analyses necessary for testing this initial model. B. What are the direct and indirect effects of z2 on z5?For x={1 2 3 4 5} and y={2 1 4 3 6} use normal equation (c =(ATA)-1ATy) to find with: a-) linear regression coefficients, b-) the linear regression equation, c-) residel sum of squares(RSS)