b) Drivers were surveyed to determine their rest time taken at the Rest & Recreation (R&R) area when they travelled back to their hometowns, during the Hari Raya holidays. A random sample of 50 drivers was selected, and the time taken by each driver to stop at the R&R were summarized as follows: Time taken to stop at the R&R (in minutes) Number of drivers 4 8 0 and less than 10 10 and less than 20 20 and less than 30 30 and less than 40 40 and less than 50 50 and less than 60 i) Construct a 'less than' ogive for the above data ii) From the ogive obtained in (i), estimate the value of X if 50% of the drivers took more than X minutes to stop at the R&R, and another 50% of the drivers took less than X minutes. 13 12 7 6 iii) Find the mean and the standard deviation of the time taken by each driver to stop at the R&R. iv) Compute the Pearson's coefficient of skewness and describe the shape of the distribution.
b) Drivers were surveyed to determine their rest time taken at the Rest & Recreation (R&R) area when they travelled back to their hometowns, during the Hari Raya holidays. A random sample of 50 drivers was selected, and the time taken by each driver to stop at the R&R were summarized as follows: Time taken to stop at the R&R (in minutes) Number of drivers 4 8 0 and less than 10 10 and less than 20 20 and less than 30 30 and less than 40 40 and less than 50 50 and less than 60 i) Construct a 'less than' ogive for the above data ii) From the ogive obtained in (i), estimate the value of X if 50% of the drivers took more than X minutes to stop at the R&R, and another 50% of the drivers took less than X minutes. 13 12 7 6 iii) Find the mean and the standard deviation of the time taken by each driver to stop at the R&R. iv) Compute the Pearson's coefficient of skewness and describe the shape of the distribution.

Glencoe Algebra 1, Student Edition, 9780079039897, 0079039898, 2018
18th Edition
ISBN:9780079039897
Author:Carter
Publisher:Carter
Chapter10: Statistics
Section10.6: Summarizing Categorical Data
Problem 22PPS

Related questions
Question
Do iii and iv.
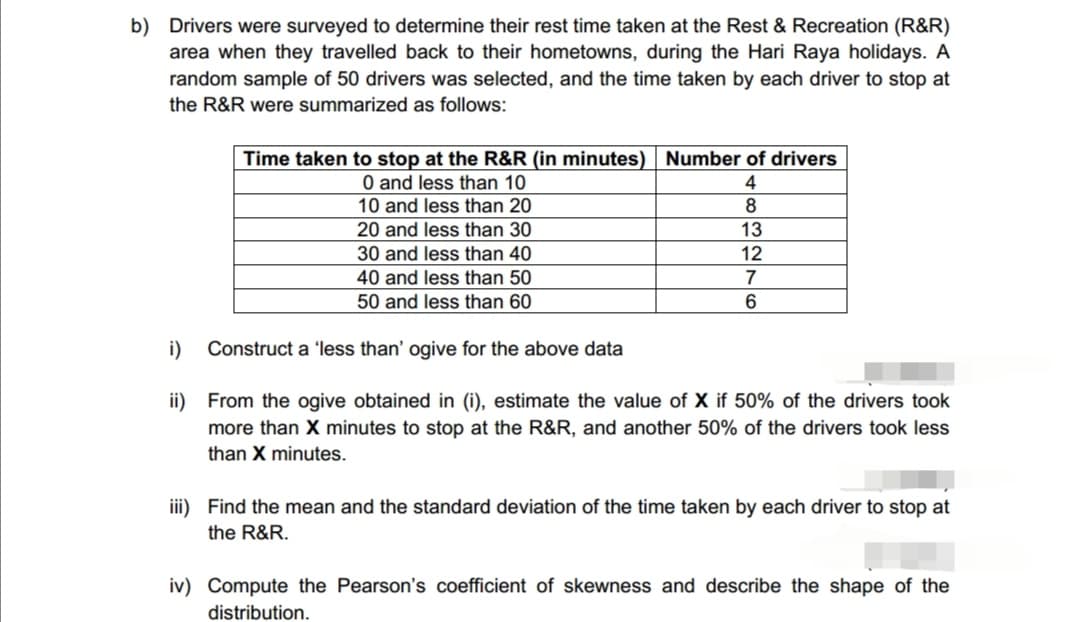
Transcribed Image Text:b) Drivers were surveyed to determine their rest time taken at the Rest & Recreation (R&R)
area when they travelled back to their hometowns, during the Hari Raya holidays. A
random sample of 50 drivers was selected, and the time taken by each driver to stop at
the R&R were summarized as follows:
Time taken to stop at the R&R (in minutes) Number of drivers
4
8
0 and less than 10
10 and less than 20
20 and less than 30
30 and less than 40
40 and less than 50
13
12
7
50 and less than 60
6
i) Construct a 'less than' ogive for the above data
ii) From the ogive obtained in (i), estimate the value of X if 50% of the drivers took
more than X minutes to stop at the R&R, and another 50% of the drivers took less
than X minutes.
iii) Find the mean and the standard deviation of the time taken by each driver to stop at
the R&R.
iv) Compute the Pearson's coefficient of skewness and describe the shape of the
distribution.
Expert Solution
This question has been solved!
Explore an expertly crafted, step-by-step solution for a thorough understanding of key concepts.

Step by step
Solved in 2 steps with 3 images

Recommended textbooks for you
Glencoe Algebra 1, Student Edition, 9780079039897…
Algebra
ISBN:
9780079039897
Author:
Carter
Publisher:
McGraw Hill

Algebra: Structure And Method, Book 1
Algebra
ISBN:
9780395977224
Author:
Richard G. Brown, Mary P. Dolciani, Robert H. Sorgenfrey, William L. Cole
Publisher:
McDougal Littell

Holt Mcdougal Larson Pre-algebra: Student Edition…
Algebra
ISBN:
9780547587776
Author:
HOLT MCDOUGAL
Publisher:
HOLT MCDOUGAL
Glencoe Algebra 1, Student Edition, 9780079039897…
Algebra
ISBN:
9780079039897
Author:
Carter
Publisher:
McGraw Hill
Algebra: Structure And Method, Book 1
Algebra
ISBN:
9780395977224
Author:
Richard G. Brown, Mary P. Dolciani, Robert H. Sorgenfrey, William L. Cole
Publisher:
McDougal Littell
Holt Mcdougal Larson Pre-algebra: Student Edition…
Algebra
ISBN:
9780547587776
Author:
HOLT MCDOUGAL
Publisher:
HOLT MCDOUGAL
