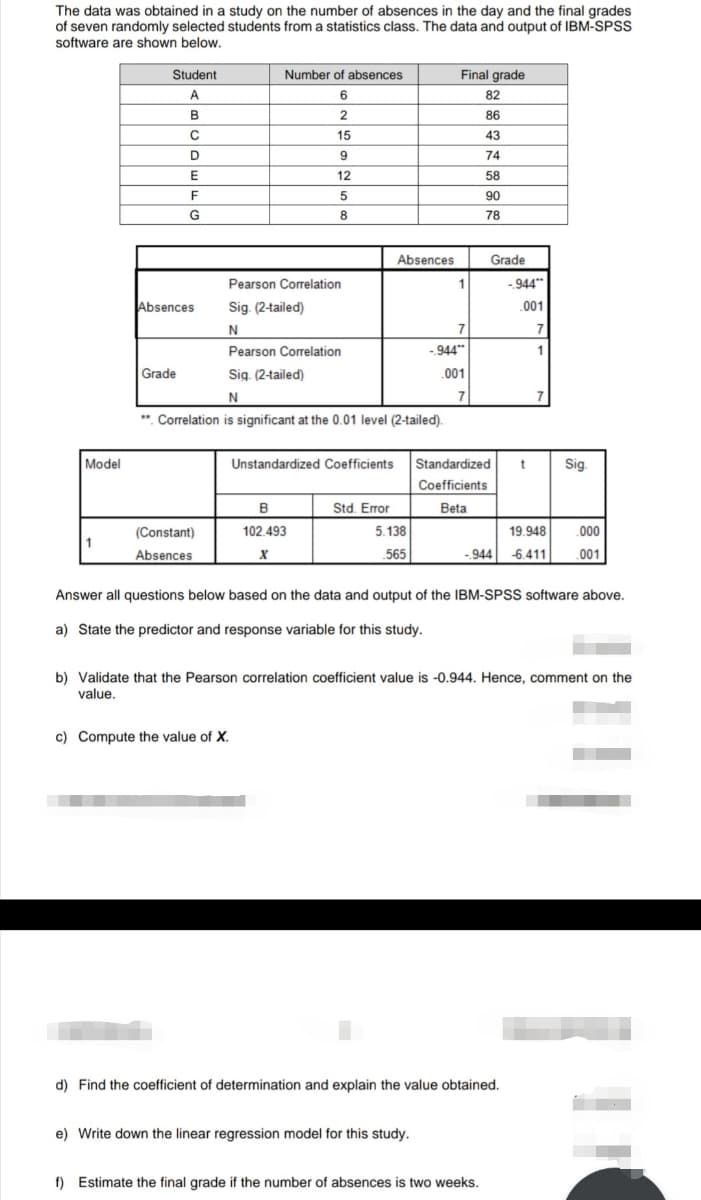
The data was obtained in a study on the number of absences in the day and the final grades of seven randomly selected students from a statistics class. The data and output of IBM-SPSS software are shown below. Model Student A B C D E F G Absences Grade (Constant) Absences Number of absences 6 2 15 9 12 5 Pearson Correlation Sig. (2-tailed) N Pearson Correlation Sig. (2-tailed) N **. Correlation is significant at the 0.01 level (2-tailed). 8 c) Compute the value of X. B 102.493 X Absences Std. Error -944 5.138 565 Final grade 82 86 43 74 58 90 78 1 7 Unstandardized Coefficients Standardized Coefficients Beta .001 7 Grade -944" 001 7 Sig. 19.948 .000 -944 6.411 .001 Answer all questions below based on the data and output of the IBM-SPSS software above. a) State the predictor and response variable for this study. b) Validate that the Pearson correlation coefficient value is -0.944. Hence, comment on the value.
The data was obtained in a study on the number of absences in the day and the final grades of seven randomly selected students from a statistics class. The data and output of IBM-SPSS software are shown below. Model Student A B C D E F G Absences Grade (Constant) Absences Number of absences 6 2 15 9 12 5 Pearson Correlation Sig. (2-tailed) N Pearson Correlation Sig. (2-tailed) N **. Correlation is significant at the 0.01 level (2-tailed). 8 c) Compute the value of X. B 102.493 X Absences Std. Error -944 5.138 565 Final grade 82 86 43 74 58 90 78 1 7 Unstandardized Coefficients Standardized Coefficients Beta .001 7 Grade -944" 001 7 Sig. 19.948 .000 -944 6.411 .001 Answer all questions below based on the data and output of the IBM-SPSS software above. a) State the predictor and response variable for this study. b) Validate that the Pearson correlation coefficient value is -0.944. Hence, comment on the value.

MATLAB: An Introduction with Applications
6th Edition
ISBN:9781119256830
Author:Amos Gilat
Publisher:Amos Gilat
Chapter1: Starting With Matlab
Section: Chapter Questions
Problem 1P

Related questions
Question
Solve the problem using formula, not excel or spss
Transcribed Image Text:The data was obtained in a study on the number of absences in the day and the final grades
of seven randomly selected students from a statistics class. The data and output of IBM-SPSS
software are shown below.
Model
Student
A
B
C
D
E
F
G
Absences
Grade
(Constant)
Absences
Number of absences
6
2
15
Pearson Correlation
Sig. (2-tailed)
N
9
12
5
8
Pearson Correlation
Sig. (2-tailed)
N
**. Correlation is significant at the 0.01 level (2-tailed).
c) Compute the value of X.
B
102.493
X
Absences
Std. Error
5.138
565
Final grade
82
86
43
74
58
90
78
Unstandardized Coefficients Standardized
Coefficients
Betal
1
7
-944"
.001
7
e) Write down the linear regression model for this study.
Grade
Answer all questions below based on the data and output of the IBM-SPSS software above.
a) State the predictor and response variable for this study.
-944"
.001
7
1
19.948
.000
-944 -6.411 .001
b) Validate that the Pearson correlation coefficient value is -0.944. Hence, comment on the
value.
d) Find the coefficient of determination and explain the value obtained.
t Sig.
f) Estimate the final grade if the number of absences is two weeks.
Expert Solution
This question has been solved!
Explore an expertly crafted, step-by-step solution for a thorough understanding of key concepts.

Step by step
Solved in 3 steps

Recommended textbooks for you
MATLAB: An Introduction with Applications
Statistics
ISBN:
9781119256830
Author:
Amos Gilat
Publisher:
John Wiley & Sons Inc

Probability and Statistics for Engineering and th…
Statistics
ISBN:
9781305251809
Author:
Jay L. Devore
Publisher:
Cengage Learning

Statistics for The Behavioral Sciences (MindTap C…
Statistics
ISBN:
9781305504912
Author:
Frederick J Gravetter, Larry B. Wallnau
Publisher:
Cengage Learning
MATLAB: An Introduction with Applications
Statistics
ISBN:
9781119256830
Author:
Amos Gilat
Publisher:
John Wiley & Sons Inc
Probability and Statistics for Engineering and th…
Statistics
ISBN:
9781305251809
Author:
Jay L. Devore
Publisher:
Cengage Learning
Statistics for The Behavioral Sciences (MindTap C…
Statistics
ISBN:
9781305504912
Author:
Frederick J Gravetter, Larry B. Wallnau
Publisher:
Cengage Learning

Elementary Statistics: Picturing the World (7th E…
Statistics
ISBN:
9780134683416
Author:
Ron Larson, Betsy Farber
Publisher:
PEARSON

The Basic Practice of Statistics
Statistics
ISBN:
9781319042578
Author:
David S. Moore, William I. Notz, Michael A. Fligner
Publisher:
W. H. Freeman

Introduction to the Practice of Statistics
Statistics
ISBN:
9781319013387
Author:
David S. Moore, George P. McCabe, Bruce A. Craig
Publisher:
W. H. Freeman