(b): Following Data are Blood Lead Concentrations of Group of workers in a country Blood Leads 0 – 9 20 – 29 | 30 – 39 40 – 49 50 – 59 60 – 69 70 – 79 80 – 99 Frequency 15 21 39 54 65 28 84 94 Find Arithmetic Mean, Median, Mode, Q1, Q3, D9, P55.
(b): Following Data are Blood Lead Concentrations of Group of workers in a country Blood Leads 0 – 9 20 – 29 | 30 – 39 40 – 49 50 – 59 60 – 69 70 – 79 80 – 99 Frequency 15 21 39 54 65 28 84 94 Find Arithmetic Mean, Median, Mode, Q1, Q3, D9, P55.

Functions and Change: A Modeling Approach to College Algebra (MindTap Course List)
6th Edition
ISBN:9781337111348
Author:Bruce Crauder, Benny Evans, Alan Noell
Publisher:Bruce Crauder, Benny Evans, Alan Noell
Chapter5: A Survey Of Other Common Functions
Section5.3: Modeling Data With Power Functions
Problem 6E: Urban Travel Times Population of cities and driving times are related, as shown in the accompanying...

Related questions
Question
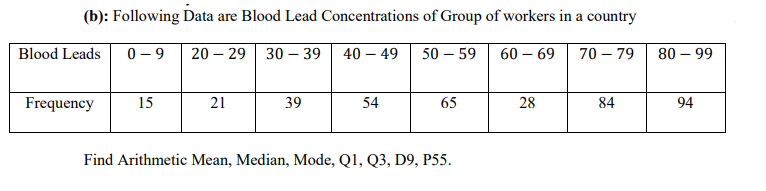
Transcribed Image Text:(b): Following Data are Blood Lead Concentrations of Group of workers in a country
Blood Leads
0 - 9
20 – 29
30 – 39
40 – 49
50 – 59
60 – 69
70 – 79
80 – 99
Frequency
15
21
39
54
65
28
84
94
Find Arithmetic Mean, Median, Mode, Q1, Q3, D9, P55.
Expert Solution


Trending now
This is a popular solution!

Step by step
Solved in 9 steps

Recommended textbooks for you
Functions and Change: A Modeling Approach to Coll…
Algebra
ISBN:
9781337111348
Author:
Bruce Crauder, Benny Evans, Alan Noell
Publisher:
Cengage Learning
Functions and Change: A Modeling Approach to Coll…
Algebra
ISBN:
9781337111348
Author:
Bruce Crauder, Benny Evans, Alan Noell
Publisher:
Cengage Learning