Approximate the mean for following frequency distribution. Class Frequency 40 - 44 45- 49 50 54 55 59 10 60 64 18 65 69 11 70 74 10 75- 79 S0 - 84 Mean = Round your answer to one decimal place, if necessary.
Approximate the mean for following frequency distribution. Class Frequency 40 - 44 45- 49 50 54 55 59 10 60 64 18 65 69 11 70 74 10 75- 79 S0 - 84 Mean = Round your answer to one decimal place, if necessary.

Glencoe Algebra 1, Student Edition, 9780079039897, 0079039898, 2018
18th Edition
ISBN:9780079039897
Author:Carter
Publisher:Carter
Chapter10: Statistics
Section10.4: Distributions Of Data
Problem 19PFA

Related questions
Question
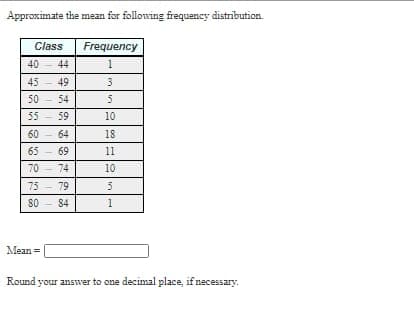
Transcribed Image Text:Approximate the mean for following frequency distribution.
Class
Frequency
40
44
1
45
49
50
54
55 - 59
10
60 - 64
18
65
69
11
70 - 74
10
75 - 79
84
Mean =
Round your answer to one decimal place, if necessary.
Expert Solution
This question has been solved!
Explore an expertly crafted, step-by-step solution for a thorough understanding of key concepts.

This is a popular solution!

Trending now
This is a popular solution!

Step by step
Solved in 2 steps with 2 images

Recommended textbooks for you
Glencoe Algebra 1, Student Edition, 9780079039897…
Algebra
ISBN:
9780079039897
Author:
Carter
Publisher:
McGraw Hill
Glencoe Algebra 1, Student Edition, 9780079039897…
Algebra
ISBN:
9780079039897
Author:
Carter
Publisher:
McGraw Hill