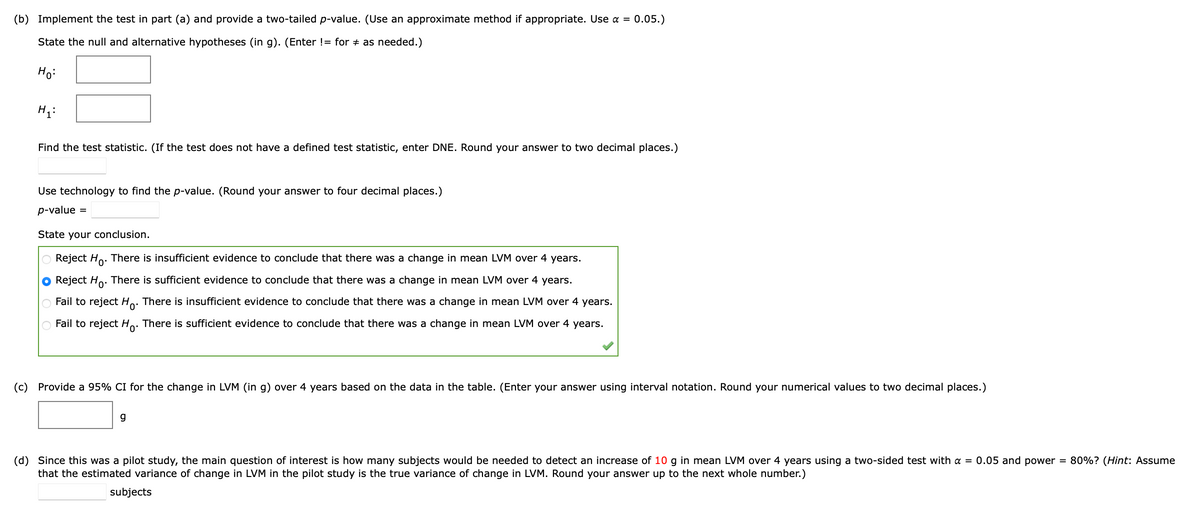
(b) Implement the test in part (a) and provide a two-tailed p-value. (Use an approximate method if appropriate. Use a = 0.05.) State the null and alternative hypotheses (in g). (Enter != for as needed.) Ho: H₂: Find the test statistic. (If the test does not have a defined test statistic, enter DNE. Round your answer to two decimal places.) Use technology to find the p-value. (Round your answer to four decimal places.) p-value= State your conclusion. Reject Ho. There is insufficient evidence to conclude that there was a change in mean LVM over 4 years. O Reject Ho. There is sufficient evidence to conclude that there was a change in mean LVM over years. Fail to reject Ho. There is insufficient evidence to conclude that there was a change in mean LVM over 4 years. Fail to reject Ho. There is sufficient evidence to conclude that there was a change in mean LVM over 4 years. (c) Provide 95% CI for the change in LVM (in g) over 4 years based on the data in the table. (Enter your answer using interval notation. Round your numerical values to two decimal places.) 9 (d) Since this was a pilot study, the main question of interest is how many subjects would be needed to detect an increase of 10 g in mean LVM over 4 years using a two-sided test with a = 0.05 and power = 80% ? (Hint: Assume that the estimated variance of change in LVM in the pilot study is the true variance of change in LVM. Round your answer up to the next whole number.) subjects
(b) Implement the test in part (a) and provide a two-tailed p-value. (Use an approximate method if appropriate. Use a = 0.05.) State the null and alternative hypotheses (in g). (Enter != for as needed.) Ho: H₂: Find the test statistic. (If the test does not have a defined test statistic, enter DNE. Round your answer to two decimal places.) Use technology to find the p-value. (Round your answer to four decimal places.) p-value= State your conclusion. Reject Ho. There is insufficient evidence to conclude that there was a change in mean LVM over 4 years. O Reject Ho. There is sufficient evidence to conclude that there was a change in mean LVM over years. Fail to reject Ho. There is insufficient evidence to conclude that there was a change in mean LVM over 4 years. Fail to reject Ho. There is sufficient evidence to conclude that there was a change in mean LVM over 4 years. (c) Provide 95% CI for the change in LVM (in g) over 4 years based on the data in the table. (Enter your answer using interval notation. Round your numerical values to two decimal places.) 9 (d) Since this was a pilot study, the main question of interest is how many subjects would be needed to detect an increase of 10 g in mean LVM over 4 years using a two-sided test with a = 0.05 and power = 80% ? (Hint: Assume that the estimated variance of change in LVM in the pilot study is the true variance of change in LVM. Round your answer up to the next whole number.) subjects

Glencoe Algebra 1, Student Edition, 9780079039897, 0079039898, 2018
18th Edition
ISBN:9780079039897
Author:Carter
Publisher:Carter
Chapter4: Equations Of Linear Functions
Section4.5: Correlation And Causation
Problem 11PPS

Related questions
Question
100%
Please help me figure this out. Thank you :)
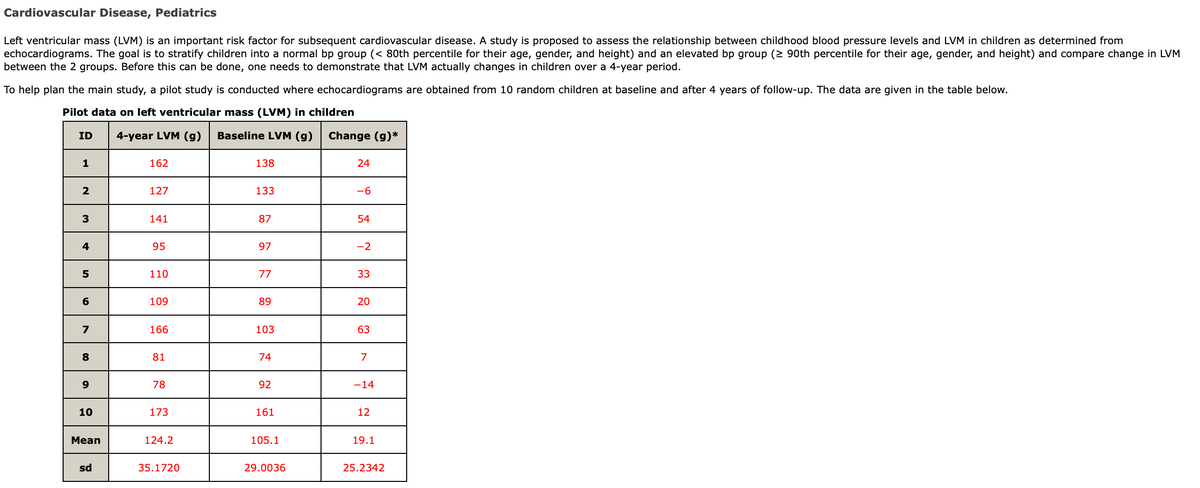
Transcribed Image Text:Cardiovascular Disease, Pediatrics
Left ventricular mass (LVM) is an important risk factor for subsequent cardiovascular disease. A study is proposed to assess the relationship between childhood blood pressure levels and LVM in children as determined from
echocardiograms. The goal is to stratify children into a normal bp group (< 80th percentile for their age, gender, and height) and an elevated bp group (≥ 90th percentile for their age, gender, and height) and compare change in LVM
between the 2 groups. Before this can be done, one needs to demonstrate that LVM actually changes in children over a 4-year period.
To help plan the main study, a pilot study is conducted where echocardiograms are obtained from 10 random children at baseline and after 4 years of follow-up. The data are given in the table below.
Pilot data on left ventricular mass (LVM) in children
ID 4-year LVM (g) Baseline LVM (g) Change (g)*
1
2
3
4
5
6
7
8
9
10
Mean
sd
162
127
141
95
110
109
166
81
78
173
124.2
35.1720
138
133
87
97
77
89
103
74
92
161
105.1
29.0036
24
-6
54
-2
33
20
63
7
-14
12
19.1
25.2342
Transcribed Image Text:0.05.)
(b) Implement the test in part (a) and provide a two-tailed p-value. (Use an approximate method if appropriate. Use α =
State the null and alternative hypotheses (in g). (Enter != for ‡ as needed.)
Ho:
H₁:
Find the test statistic. (If the test does not have a defined test statistic, enter DNE. Round your answer to two decimal places.)
Use technology to find the p-value. (Round your answer to four decimal places.)
p-value =
State your conclusion.
O Reject Ho. There is insufficient evidence to conclude that there was a change in mean LVM over 4 years.
O Reject Ho. There is sufficient evidence to conclude that there was a change in mean LVM over 4 years.
Fail to reject Ho. There is insufficient evidence to conclude that there was a change in mean LVM over 4 years.
Fail to reject Ho. There is sufficient evidence to conclude that there was a change in mean LVM over 4 years.
(c) Provide a 95% CI for the change in LVM (in g) over 4 years based on the data in the table. (Enter your answer using interval notation. Round your numerical values to two decimal places.)
g
(d) Since this was a pilot study, the main question of interest is how many subjects would be needed to detect an increase of 10 g in mean LVM over 4 years using a two-sided test with a = 0.05 and power = 80%? (Hint: Assume
that the estimated variance of change in LVM in the pilot study is the true variance of change in LVM. Round your answer up to the next whole number.)
subjects
Expert Solution
Step 1
Given that a pilot study is conducted where echocardiograms are obtained from 10 random children at baseline and four-year follow-up as
| ID | 4-year LVM (g) | Baseline LVM (g) | Change (g)* |
| 1 | 162 | 138 | 24 |
| 2 | 127 | 133 | -6 |
| 3 | 141 | 87 | 54 |
| 4 | 95 | 97 | -2 |
| 5 | 110 | 77 | 33 |
| 6 | 109 | 89 | 20 |
| 7 | 166 | 103 | 63 |
| 8 | 81 | 74 | 7 |
| 9 | 78 | 92 | -14 |
| 10 | 173 | 161 | 12 |
| Mean | 124.2 | 105.1 | 19.1 |
| sd | 35.17196 | 29.00364 | 25.23424 |

Trending now
This is a popular solution!

Step by step
Solved in 4 steps

Recommended textbooks for you
Glencoe Algebra 1, Student Edition, 9780079039897…
Algebra
ISBN:
9780079039897
Author:
Carter
Publisher:
McGraw Hill

Big Ideas Math A Bridge To Success Algebra 1: Stu…
Algebra
ISBN:
9781680331141
Author:
HOUGHTON MIFFLIN HARCOURT
Publisher:
Houghton Mifflin Harcourt

Holt Mcdougal Larson Pre-algebra: Student Edition…
Algebra
ISBN:
9780547587776
Author:
HOLT MCDOUGAL
Publisher:
HOLT MCDOUGAL
Glencoe Algebra 1, Student Edition, 9780079039897…
Algebra
ISBN:
9780079039897
Author:
Carter
Publisher:
McGraw Hill
Big Ideas Math A Bridge To Success Algebra 1: Stu…
Algebra
ISBN:
9781680331141
Author:
HOUGHTON MIFFLIN HARCOURT
Publisher:
Houghton Mifflin Harcourt
Holt Mcdougal Larson Pre-algebra: Student Edition…
Algebra
ISBN:
9780547587776
Author:
HOLT MCDOUGAL
Publisher:
HOLT MCDOUGAL