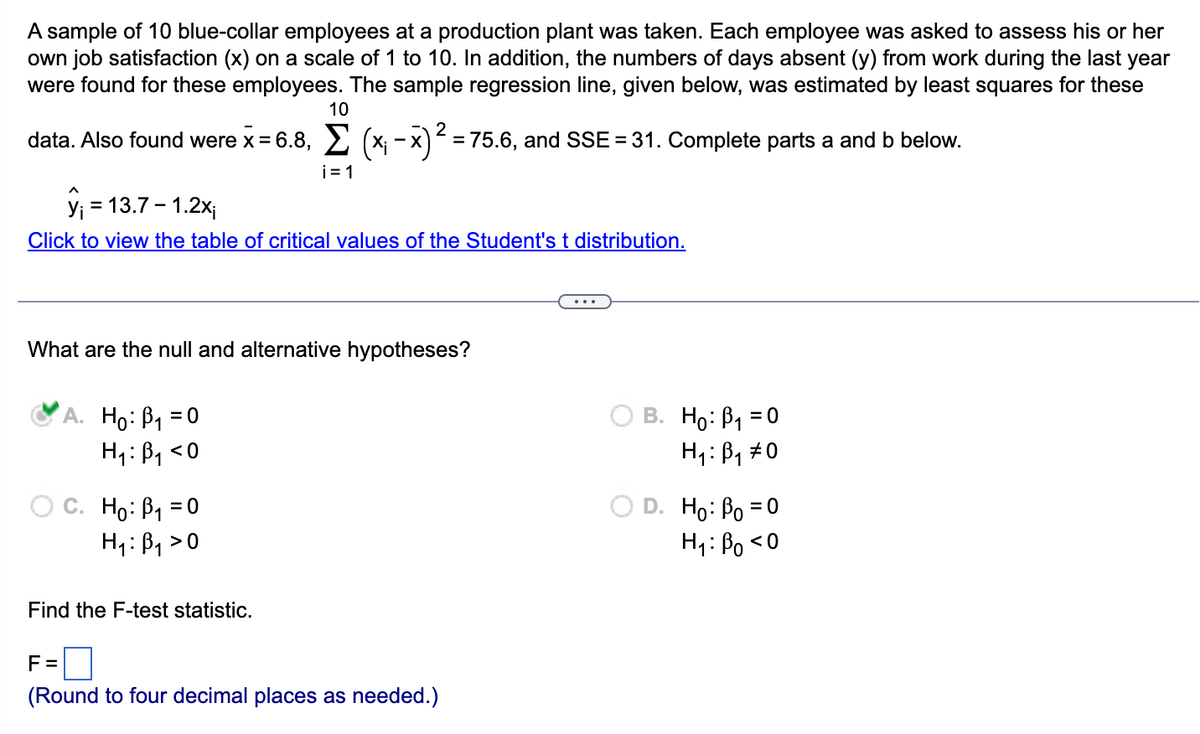
Find the F-test statistic.


Q: Experimenters wants to assess the association between X and Y, the scatter plot of X and Y showed a…
A: As per the given information, the scatter plot of X and Y shows quadratic pattern.
Q: What is the standard error of estimate?
A: We know that The standard error of the estimate represents the variability of the dependent values…
Q: An experiment consists of casting a pair of dice and observing the number that falls uppermost on…
A: GivenA pair of die is rolled
Q: tail, you win $6. if you play this game many times, will you come out ahead? (i.e. will you gain…
A: The game of tossing a biased coin. P(H) = 25 and P(T) = 35 To find the expected value.
Q: Class width of 8-24
A: given class : 8-24 lower limit of class = 8 upper limit of class = 24 class width = ?
Q: Many newspapers carry a certain puzzle in which the reader must unscramble letters to form words.…
A: To unscramble the letters and form a word, we can arrange them as "WORTHY". The probability of…
Q: A university wants to investigate how much its students spend on textbooks each semester. Since all…
A: The variable of interest is how much students spend on textbooks each semester. The sample size…
Q: The FALSE statement regarding the properties of the estimators is: a. The least squares…
A: we are given with the 4 statement regarding regression analysis and linear model . a. The least…
Q: Use the probability generating functions to derive the formula for the average small components size…
A: To derive the formula for the average small component size when GC is present using probability…
Q: What sample size might be better and why- 3 or 300? For the above problem, if the overall score of…
A: Examining the academic achievement of a group of third graders at a nearby school in social studies.…
Q: A candy company says that 20% of their candies are red. Suppose you examine a sample of 83 random…
A: given data P(red) = p = 0.20 sample size(n) = 83 standard error for sample proportion = ?
Q: How do you go from 0.5833 to 0.7202
A: Given data : Use the Standard Normal Distribution to answer the following question: The mean serum…
Q: Download the dataset "HT_5038.xls" and conduct a two-sample t-test using Excel. (You can find the…
A: The μ1 is the mean of population 1 The μ2 is the mean of population 2 The standard deviation of the…
Q: 5. When rolling a pair of dice, the chance of rolling doubles (both the same number) is 1/6. For…
A: Given: We are rolling a pair of dice. The chance of rolling doubles (both the same numbers) is given…
Q: Find the line that best fits the given points. and compute the correlation coefficient r. (Round all…
A: This question involves finding the regression equation and value of R2 for the given data set. The…
Q: Below are the jersey numbers of 11 players randomly selected from a football team. Find the range,…
A: We have given data are 48,15,12,50,1,76,94,43,46,23,79 From the given data we make the following…
Q: 1. Make a vector from 1 to 100. Make a for-loop which runs through the whole vector. Multiply the…
A: This question requires creating a vector of numbers from 1 to 100 and performing a for-loop which…
Q: A thief steals an ATM card and must randomly guess the correct three-digit pin code from a 9-key…
A: ATM has 3 digit pinjcode. there are 9 key key pad and repetition of digit is allowed. P(correct…
Q: Why are z scores useful, rather than just trying to interpret raw scores?
A: The random variable X is normally distributed with a mean μ and standard deviation X~N(μ,σ) Then…
Q: Log Transformations. The log-transformed values of n = 90 concentration measurements have an average…
A:
Q: What are the steps to figuring this out...I can't remember... On a test with a mean of 100 and a…
A: Given that Mean of 100 and a standard deviation of 20
Q: A high school physics teacher wondered if his students in the senior class this year will be more…
A: Given that, The sample size n=50 The level of significance α=0.05 The student chooses the following…
Q: How was the standard deviation of 1.875 calculated. Please show the formular clearly as to the…
A: Topic is log transformation so it is clear that we can assume that the transformed data is…
Q: A student has a test score of 48.4 on a test having a mean of 66 and a standard deviation of 11. A.…
A: given data μ = 66σ = 11x = 48.4
Q: For each random Sample compute the mean, variance and STANDARD Deviation b) 11.2, 10.0, 25.4, 8.4,…
A: From the provided information, The data values are as follow: 11.2, 10.0, 25.4, 8.4, 11.0
Q: Hemoglobin levels in adult females are normally distributed with a mean of 12 g/dL and a standard…
A: Given that: Population mean, μ=12 Population standard deviation, σ=1.1 The normal hemoglobin range…
Q: 1. The concepts of inference are hinged on observing and getting information from the population…
A: Note: According to Bartleby guidelines expert solve only one question and rest can be reposted.
Q: The probability that a tutor will see 0, 1, 2, 3, or 4 students. Question 1 X 1 2 P(x) 0.05 0.1 0.05…
A: The given prob. distribution for the no. of students seen by a tutor is: x 0 1 2 3 4 Px 0.05…
Q: K When testing for current in a cable with eleven color-coded wires, the author used a meter to test…
A: Given that. Number of cable=11 Pair of cable test=3
Q: Chapter 09, Testbank, Question 074-077 In a hypothesis test with hypotheses Ho : H = 90 and H : H #…
A: Given The hypothesis is H0: μ=90 and H1: μ≠90 Sample mean, x¯=85.9 Sample sd, s=6.6 α=0.10 Sample…
Q: a) If we expected an increase in sample B, what are the results of the test of significance? (THINK…
A:
Q: 6.15 Random samples of size n₁ = 8 and n₂ = 8 were selected from populations A and B. respectively.…
A:
Q: Data Random number generator to generate 50 values between zero and one. 0.0829 0.1917 0.8315…
A: Arrange the numbers in ascending…
Q: Help! I cannot figure out how to figure the scores in between... What percentage of scores fall…
A: P(0.84< Z< 2.07)=?
Q: Aside from the differences in symbols, the only difference between the SS, variance, and standard…
A:
Q: 4. Let X^N (0,8²). Find the CRLB for variances of the unbiased estimator of t(0)= 0².
A: Given that X follows Normal with mean = 0 and variance Θ2. Note : According to our guidelines we…
Q: Download the dataset "HT_3042.xls" and conduct a two-sample t-test using Excel. (You can find the…
A: Null Hypothesis: H0: The means of the two samples (column A and column B) are the same. Alternative…
Q: Sherry is a production manager for a small manufacturing shop and is interested in developing a…
A: Note:“Since you have posted a question with multiple sub parts, we willprovide the solution only to…
Q: Times for a surgical procedure are normally distributed. There are two methods. Method A has a mean…
A: Given information: Method A has a mean of 32 minutes and a standard deviation of 4 minutes, Method B…
Q: A survey showed that 31% of human resource professionals are at companies that rejected job…
A: Given that: Success probability, p=0.31 Sample size, n=25
Q: Download the dataset "HT_4029.xls" and conduct a two-sample t-test using Excel. (You can find the…
A: The objective is to test the null hypothesis that the means of the two samples (column A and column…
Q: The Table below shows the signals for 10 blank measurements. Based on these data and on the…
A: This question is asking for the determination of the Limit of Detection (LOD) and Limit of…
Q: 7. It is estimated that 13% of the U.S. student population is left-handed. A simple random sample of…
A: Given p=13%, X=28, n=200
Q: In a test of HO: μ-25 against HA: μ# 25, a sample of size 125 produces Z = 1.28 for the value of the…
A: by bartleby policy i can gives only one question answers at a time : 1) n=125 Z=1.28 null and…
Q: The accompanying data table lists measured amounts of chest compression (mm) from car crash tests.…
A:
Q: Airlines sometimes overbook flights (that is, they sell more tickets than there are seats on the…
A: Given data is x 45 46 47 48 49 50 51 52 53 54 55 p(x) 0.05 0.10 0.12 0.14 0.28 0.17 0.06 0.02…
Q: The annual rainfall in a certain region is approximately normally distributed with mean 40.6 inches…
A: The question is about normal distribution Given : Popl. mean annual rainfall in a certain region ( μ…
Q: The research hypothesis posits that the more caffeine consumed by a subject, the longer a subject…
A: The question is about testing of correl. coefficient Given : No. of subjects ( n ) = 10 Value of…
Q: Y x+3 v=2r w = 2x +3 =
A: Given that. X~N( μ , ?) μ=E(x)=4 , ?2=Var(x) =1
Q: Question You have been directed to reduce the costs that make up the first 75% of monthly…
A: The provided graph indicates the current monthly expenditure in terms of percentage. Moreover, the…


Trending now
This is a popular solution!

Step by step
Solved in 2 steps

- The data regarding the production of wheat in tons (X) and the price of the kilo of flour in Ghana cedis (Y) Takoradi some years ago were: a. Fit the regression line for the day using the method of least squaresThe least-squares regression line relating two statistical variables is given as = 24 + 5x. Compute the residual if the actual (observed) value for y is 38 when x is 2. 4 38 2A researcher collected data on the cholesterol level, CC, and the age, AA, of 24 people selected at random. Using the data, the researcher calculated the least-squares regression line to be Cˆ=182+2.2AC^=182+2.2A and the standard error of the slope to be 0.38. If the conditions for inference are met, which of the following is closest to the value of the test statistic to test the hypotheses H0:β=0H0:β=0 versus Ha:β≠0Ha:β≠0 ?
- For a sample of 8 employees, a personnel director has collected the following data on ownership of company stock, y, versus years with the firm, x. X 6 12 14 6 9 13 15 9 Y 300 408 560 252 288 650 630 522 (a) Determine the least-squares regression line and interpret its slope(b) For an employee who has been with the firm 10 years, what is the predicted number of shares owned? (c) Is there a statistical significance between years of service and ownership of company stocks? (use α=0.05α=0.05)An owner of a home in the Midwest installed solar panels to reduce heating costs. After installing the solar panels, he measured the amount of natural gas used y (in cubic feet) to heat the home and outside temperature x (in degree-days, where a day's degree-days are the number of degrees its average temperature falls below 65° F) over a 23-month period. He then computed the least-squares regression line for predicting y from x and found it to be ŷ = 85 + 16x. The software used to compute the least-squares regression line for the equation above says that r2 = 0.98. This suggests which of the following? 1. Gas used increases by square root of 0.98 = 0.99 cubic feet for each additional degree-day? 2. Although degree-days and gas used are correlated, degree-days do not predict gas used very accurately. 3. Prediction of gas used from degree-days will be quite accurate.For variables x1, x2, x3, and y satisfying the assumptions for multiple linear regression inferences, the population regression equation is y = 27 – 4.7x1 + 2.3x2 + 5.8x3. For samples of size 20 and given values of the predictor variables, the distribution of the estimates of β1 for all possible sample regression planes is a _________ distribution with mean _________ and standard deviation _______.
- 1. Prior to being hired, the ve salespersons for a computer store were given a standard sales aptitude test. For each individual, the score achieved on the aptitude test and the number of computer systems sold during the first 3 months of their employment are shown in the attached image. (a) Determine the least-squares regression line and interpret its slope. (b) Estimate, for a new employee who scores 60 on the sales aptitude test, the number of units the new employee will sell in her first 3 months with the company. (c) Find the standard error of estimate. (d) Find the r-square of the model.Years of Work Experience and number of Job Offers of 10 job-seekers were as follows: Work Exp. 4 2 5 3 7 12 2 5 4 9 No. of Offers 7 1 8 4 13 19 3 11 9 15 a. Fit the regression equation of No. of Job Offers on Years of Work Experience. b. What will be the predicted number of offers for an applicant with 6 years of experience? c. Verify the relationship between the number of job offers and years of work experience using at least two relevant methodsWhat is the slope of the least-squares regression line for these data? Carry your intermediate computations to at least four decimal places and round your answer to at least three decimal places.
- A company trains its employees with instructional videos and claims that the amount of time, in hours, spent training is linearly related to an increase in productivity. The company selected a random sample of five employees to test its claim. The data were used to create the computer output for a least-squares linear regression, shown in the table. Variable DF Estimate SE Intercept 1 3.6 1.1489 Hours 1 0.8 0.3464 Which of the following is the correct test statistic and number of degrees of freedom? t=2.31 with 4 degrees of freedom A t=2.31 with 3 degrees of freedom B t=2.31 with 5 degrees of freedom C t=3.13 with 1 degree of freedom D t=3.13 with 3 degrees of freedom ESuppose Wesley is a marine biologist who is interested in the relationship between the age and the size of male Dungeness crabs. Wesley collects data on 1,000 crabs and uses the data to develop the following least-squares regression line where ? is the age of the crab in months and ?̂ is the predicted value of ?, the size of the male crab in cm. ?̂=8.2052+0.5693? What is the value of ?̂ when a male crab is 21.7865 months old? Provide your answer with precision to two decimal placeThe following table presents the percentage of students who tested proficient in reading and the percentage who tested proficient in math for 5 randomly selected states in the United States. Compute the least-squares regression line for predicting math proficiency from reading proficiency. State Percent Proficientin Reading Percent Proficientin Mathematics Illinois 75 70 North Carolina 71 73 California 60 59 Georgia 67 64 Florida 66 68 Send data to Excel The equation for the least squares regression line is y = . Round the slope and y -intercept to four decimal places as needed.
