b) Let Z₁ = X-x~N (0,1), and Wi σχ YHY~N(0,1), for i=1,2,3,...,10, then: ay i) State, with parameter(s), the probability distribution of the statistic, T = W₁2 Σ117,3 iii) Calculate the probability that a statistic T = Z₁ + W₁ is at most 4. ii) Find the mean and variance of the statistic T =
b) Let Z₁ = X-x~N (0,1), and Wi σχ YHY~N(0,1), for i=1,2,3,...,10, then: ay i) State, with parameter(s), the probability distribution of the statistic, T = W₁2 Σ117,3 iii) Calculate the probability that a statistic T = Z₁ + W₁ is at most 4. ii) Find the mean and variance of the statistic T =

Algebra & Trigonometry with Analytic Geometry
13th Edition
ISBN:9781133382119
Author:Swokowski
Publisher:Swokowski
Chapter10: Sequences, Series, And Probability
Section10.8: Probability
Problem 31E

Related questions
Question
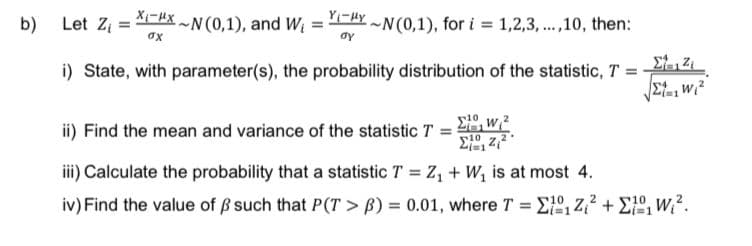
Transcribed Image Text:b)
X-XN (0,1), and W₁
σχ
YHYN(0,1), for i=1,2,3,...,10, then:
Let Z₁ =
i) State, with parameter(s), the probability distribution of the statistic, T =
ay
10
ΣW2
√Σt,w₁²
ii) Find the mean and variance of the statistic T =
10
Σ{12/2
iii) Calculate the probability that a statistic T = Z₁ + W₁ is at most 4.
iv) Find the value of ß such that P(T> B) = 0.01, where T = E₁Z²+₁ W².
Expert Solution
This question has been solved!
Explore an expertly crafted, step-by-step solution for a thorough understanding of key concepts.

Step by step
Solved in 4 steps with 3 images

Recommended textbooks for you
Algebra & Trigonometry with Analytic Geometry
Algebra
ISBN:
9781133382119
Author:
Swokowski
Publisher:
Cengage
Algebra & Trigonometry with Analytic Geometry
Algebra
ISBN:
9781133382119
Author:
Swokowski
Publisher:
Cengage