5- There is two project as follows: Probabilities The first year A B 25% 1000 500 50% 2000 1000 25% 3000 4000 is assumed the discount rate of projects is 10% a year, d of years. In addition, the initial expenditures of proje
5- There is two project as follows: Probabilities The first year A B 25% 1000 500 50% 2000 1000 25% 3000 4000 is assumed the discount rate of projects is 10% a year, d of years. In addition, the initial expenditures of proje

MATLAB: An Introduction with Applications
6th Edition
ISBN:9781119256830
Author:Amos Gilat
Publisher:Amos Gilat
Chapter1: Starting With Matlab
Section: Chapter Questions
Problem 1P

Related questions
Question
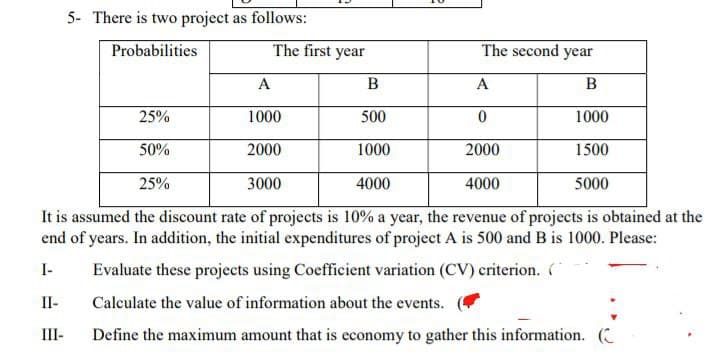
Transcribed Image Text:5- There is two project as follows:
Probabilities
25%
50%
The first year
B
500
1000
2000
1500
3000
4000
4000
5000
It is assumed the discount rate of projects is 10% a year, the revenue of projects is obtained at the
end of years. In addition, the initial expenditures of project A is 500 and B is 1000. Please:
I-
Evaluate these projects using Coefficient variation (CV) criterion. (
II-
Calculate the value of information about the events.
III-
Define the maximum amount that is economy to gather this information. (
25%
A
1000
The second year
B
1000
2000
A
0
Expert Solution
This question has been solved!
Explore an expertly crafted, step-by-step solution for a thorough understanding of key concepts.

Step by step
Solved in 5 steps

Recommended textbooks for you
MATLAB: An Introduction with Applications
Statistics
ISBN:
9781119256830
Author:
Amos Gilat
Publisher:
John Wiley & Sons Inc

Probability and Statistics for Engineering and th…
Statistics
ISBN:
9781305251809
Author:
Jay L. Devore
Publisher:
Cengage Learning

Statistics for The Behavioral Sciences (MindTap C…
Statistics
ISBN:
9781305504912
Author:
Frederick J Gravetter, Larry B. Wallnau
Publisher:
Cengage Learning
MATLAB: An Introduction with Applications
Statistics
ISBN:
9781119256830
Author:
Amos Gilat
Publisher:
John Wiley & Sons Inc
Probability and Statistics for Engineering and th…
Statistics
ISBN:
9781305251809
Author:
Jay L. Devore
Publisher:
Cengage Learning
Statistics for The Behavioral Sciences (MindTap C…
Statistics
ISBN:
9781305504912
Author:
Frederick J Gravetter, Larry B. Wallnau
Publisher:
Cengage Learning

Elementary Statistics: Picturing the World (7th E…
Statistics
ISBN:
9780134683416
Author:
Ron Larson, Betsy Farber
Publisher:
PEARSON

The Basic Practice of Statistics
Statistics
ISBN:
9781319042578
Author:
David S. Moore, William I. Notz, Michael A. Fligner
Publisher:
W. H. Freeman

Introduction to the Practice of Statistics
Statistics
ISBN:
9781319013387
Author:
David S. Moore, George P. McCabe, Bruce A. Craig
Publisher:
W. H. Freeman