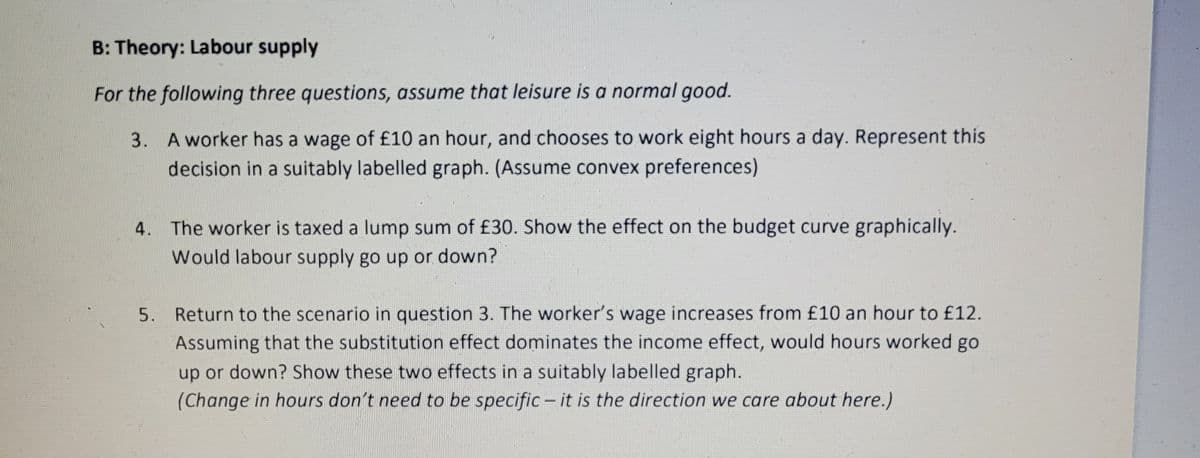
B: Theory: Labour supply For the following three questions, assume that leisure is a normal good. 3. A worker has a wage of £10 an hour, and chooses to work eight hours a day. Represent this decision in a suitably labelled graph. (Assume convex preferences) 4. The worker is taxed a lump sum of £30. Show the effect on the budget curve graphically. Would labour supply go up or down? 5. Return to the scenario in question 3. The worker's wage increases from £10 an hour to £12.
B: Theory: Labour supply For the following three questions, assume that leisure is a normal good. 3. A worker has a wage of £10 an hour, and chooses to work eight hours a day. Represent this decision in a suitably labelled graph. (Assume convex preferences) 4. The worker is taxed a lump sum of £30. Show the effect on the budget curve graphically. Would labour supply go up or down? 5. Return to the scenario in question 3. The worker's wage increases from £10 an hour to £12.
Principles of Microeconomics
7th Edition
ISBN:9781305156050
Author:N. Gregory Mankiw
Publisher:N. Gregory Mankiw
Chapter1: Ten Principles Of Economics
Section: Chapter Questions
Problem 6PA
Related questions
Question
Help me with question 4 please.

Transcribed Image Text:B: Theory: Labour supply
For the following three questions, assume that leisure is a normal good.
3.
A worker has a wage of £10 an hour, and chooses to work eight hours a day. Represent this
decision in a suitably labelled graph. (Assume convex preferences)
4. The worker is taxed a lump sum of £30. Show the effect on the budget curve graphically.
Would labour supply go up or down?
5. Return to the scenario in question 3. The worker's wage increases from £10 an hour to £12.
Assuming that the substitution effect dominates the income effect, would hours worked go
up or down? Show these two effects in a suitably labelled graph.
(Change in hours don't need to be specific - it is the direction we care about here.)
Expert Solution
This question has been solved!
Explore an expertly crafted, step-by-step solution for a thorough understanding of key concepts.
Step by step
Solved in 3 steps with 2 images

Knowledge Booster
Learn more about
Need a deep-dive on the concept behind this application? Look no further. Learn more about this topic, economics and related others by exploring similar questions and additional content below.Recommended textbooks for you

Principles of Microeconomics
Economics
ISBN:
9781305156050
Author:
N. Gregory Mankiw
Publisher:
Cengage Learning


Brief Principles of Macroeconomics (MindTap Cours…
Economics
ISBN:
9781337091985
Author:
N. Gregory Mankiw
Publisher:
Cengage Learning

Principles of Microeconomics
Economics
ISBN:
9781305156050
Author:
N. Gregory Mankiw
Publisher:
Cengage Learning


Brief Principles of Macroeconomics (MindTap Cours…
Economics
ISBN:
9781337091985
Author:
N. Gregory Mankiw
Publisher:
Cengage Learning

Essentials of Economics (MindTap Course List)
Economics
ISBN:
9781337091992
Author:
N. Gregory Mankiw
Publisher:
Cengage Learning


Principles of Microeconomics (MindTap Course List)
Economics
ISBN:
9781305971493
Author:
N. Gregory Mankiw
Publisher:
Cengage Learning