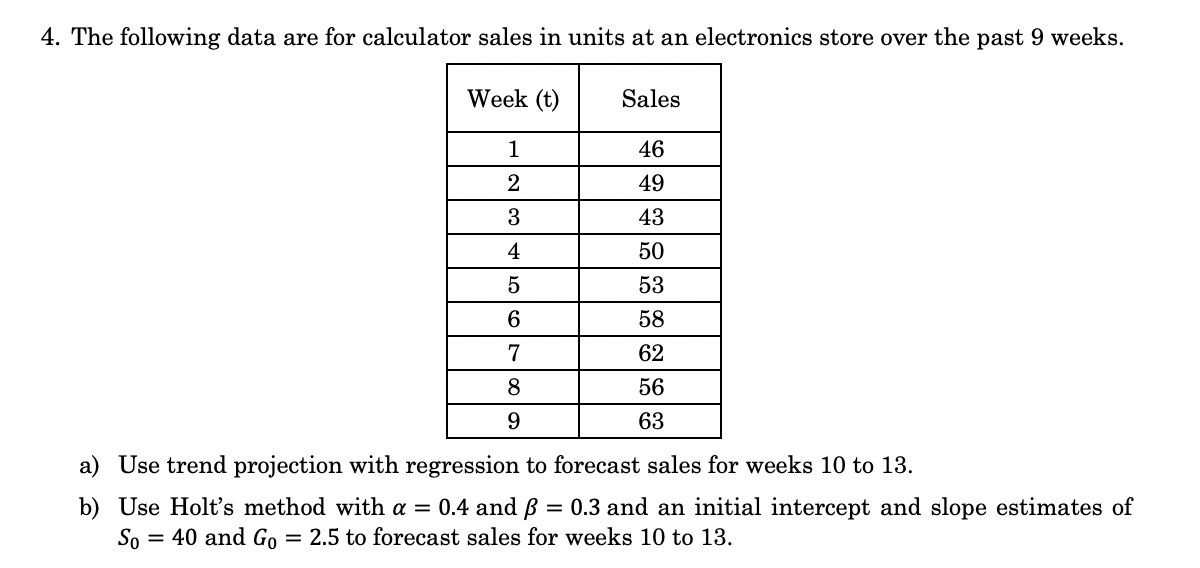
b) Use Holt's method with a = 0.4 and ß = 0.3 and an initial intercept and slope estimates of So = 40 and Go = 2.5 to forecast sales for weeks 10 to 13.


Q: The voltage output (y) of a battery was measured over a range of temperatures (x) from 0°C to 50°C.…
A: The scatterplot of the linear model, quadratic model and cubic model is given. All the three…
Q: a. Determine the slope (?1) and the y-intercept (?0). b. Formulate the estimated simple linear…
A: As per our guidelines , we are allowed to answer three sub-parts Given : The marketing manager of…
Q: Figure 1 reports a scatter plot of hhinc (horizontal axis) and size (vertical axis). Do you see any…
A: Given :
Q: To investigate the relationship between yield of potatoes, y, and level of fertilizer application,…
A: Sxx is the sum of the square of the difference between x and mean of x.
Q: Find a linear model for the data graphed in the scatter plot. y
A: From the given scatter plot, The observations are, X Y 0 20 1 25 2 30 3 35 4 40
Q: Drag each of the scatter plots given above into the appropriate area below. Age and body temperature…
A: Scatterplot: A scatterplot is a type of data display that shows the relationship between two…
Q: As people age, daily stress and worry decrease and happiness increases, according to an analysis of…
A:
Q: The median home value in Ohio and South Carolina (adjusted for inflation) are shown below. Year Ohio…
A: a)rate of increase ohio=103700-503002000-1950=1068 /yr south…
Q: The following linear plot is derived from a function of the form y = ae" ba , where a and b are…
A:
Q: Use the regression capabilities of a graphing calculator to find the equation of the line of best…
A: Regression: It is a technique which is used to determine relationship between two or more…
Q: Alejandro is selling HDMI cables on eBay, and is trying to determine the best price to sell at. For…
A: Part a: It has been given that the line of best fit passes through the points (3.50, 280) and (4.75,…
Q: idge nit 3: Linear Functions Assessment NAME Level 2 1. Find the slope of the line passing through…
A: Given that: Two points given as (2, -8) and (3, 1)
Q: 3 The following table contains the ACT scores and the GPA (grade point average) for eight college…
A: Hello. Since your question has multiple sub-parts, we will solve first three sub-parts for you. If…
Q: For each of the following data sets, construct a scatter plot, draw a line of best fit, use two…
A:
Q: Given the following data points: (xp, Yn) = (1, 2), (2, 4), (5, 6), (6, 8) Determine the best-fit…
A: Given points 1,2,2,4,5,6,6,8 Determine the best fit quadratic curve that passes through 0,1 Show…
Q: Lindiwe suspected that the relationship between temperature and electricity consumption is not…
A: Given graph is : we need to predict the average unit of electricity used when the peak temperature…
Q: a) Calculate Bo, the value of the estimated intercept. b) Calculate the estimated systolic blood…
A: Solution: Given information: n = 14 observation X= 26Var(X)= 11.104Y= 132Var(Y)= 205Cov(X,Y)=…
Q: Fit a straight line to the following data: Year: 2010 2011 2012 2013 2014 2015 Profit (000's 7.
A:
Q: Portray the following hypothetical data on a two-variable diagram: Academic year Total…
A: Let us define the independent (X) and dependent (Y) first. Let , X be the total Enrollment /Year…
Q: 1. Suppose that you have the following model and data to estimate the following equation Nobs YX,X,…
A: Excel Procedure: Enter X2, X3 and Y data in Excel Go to Data Click on Data Analysis>…
Q: The table below represents the number of loans approved for different amounts during the second half…
A:
Q: QUESTION 2 The holder of Cypres Recordings studied the relationship among sales (y) and the amount…
A: Given : intercept, a = 15.97 slope, b = 0.77
Q: he sales recording for nokia mobile phones are given plot the data , also tell about the process…
A: Time Series refers to the arrangement of data in chronological order. A time series is a type of…
Q: Level 4 Identify the transformation taking place and use slope to justify. D'
A: Graph of the triangles are given, we have to find its transformation
Q: 33 As the number of units manufactured increases from 100 to 200, manufacturing cost (total) in-…
A: Given , As number of units manufactured increases from 100 to 200 manufacturing cost increases from…
Q: Use the regression capabilities of a graphing calculator to find the equation of the line of best…
A: Regression: It is a technique which is used to determine relationship between two or more…
Q: Years I 2005 2006 2007 Quarterly II 65 78 68 70 80 70 60 75 75 determine the seasonal pattern with…
A: Seasonal variations are those variations that tend to repeat themselves over a period of time…
Q: Engineering, a company that specializes in the construction of antipollution filtration devices, has…
A: Hi! Thank you for the question, As per the honor code, we are allowed to answer three sub-parts at a…
Q: Consider the estimated equation from your textbook: Test Score= 698.9-2.28x STR, R =0.051, SER= 18.6…
A: Solution: The estimated regression equation is Test score ^=698.9-2.28×STR β1^= -2.28 slope of the…
Q: Using Excel, Big Poppa's estimates the weekly demand function for its BBQ sandwiches to be Qª =…
A: Given information: The regression equation for the weekly demand function for its BBQ sandwiches is…
Q: Stratton, Inc., has collected the following information on its cost of electricity: Machine…
A:
Q: The median home value in Oklahoma and New Jersey (adjusted for inflation) are shown below: Year…
A: Given: Data is given
Q: Alejandro is selling HDMI cables on eBay, and is trying to determine the best price to se!! at. For…
A:
Q: Based on the data shown in question 17, please estimate the slope and the intercept of the…
A: here given , n = 12 x¯ = 0.12 y¯ = 1.117 sx = 0.11724sy = 0.31175r = -0.9506
Q: Coca - Cola Company had sals of S18 , 546 million in 1996 and $ 21.900 million in 2004 Use the…
A: The Coca - Cola Company had sals of S18 , 546 million in 1996 and $ 21.900 million in 2004 Use the…
Q: A set of X and Y scores has SSX = 5, SSY = 7.5, and SP = 15. The regression equation for these…
A: Given information: SSx=5SSY=7.5SP=15 Formula for the slope of the regression equation is,…
Q: D. Graph the following regression lines. - y = 0.3x + 2.5
A:
Q: ) In which state have home values increased at a higher rate? Correct b) If these trends were…
A:
Q: Given the values in the following table, what is the slope - intercept form of the data? 3 4 -2 1 4…
A: I am going to solve the given problem by using some simple algebra to get the required result of the…
Q: 10. In 2010 consumption (Ci) for selected countries was as follows Jordan 2.5 billion $, USA 100…
A: Let us take an estimated regression model as Where Y : Response and X : Predictor, a^ and b^ are…
Q: The following function is a fictional equation for an experiment. The tis manipulated and the ris…
A: The equation of a line is given by the slope-point formula as y=mx+c. Here, m is the slope off the…
Q: Use the regression capabilities of a graphing calculator to find the equation of the line of best…
A:
Q: The computer-science aptitude score, x, and the achievement score, y (measured by a comprehensive…
A:
Q: 1) Estimated value of the slope, B, is O 0.905 0.840 O 0.760 O 1.333 2) Estimated value of the…
A: As per our guidelines, we are allowed to answer first three sub-parts only . Thanks. Given Data :…
Q: Given the following graph, calculate the slope and uncertainty in the slope. Pressure vs Volume P…
A: Introduction - slope m=y2-y1x2-x1 Uncertainty of slope - one half of the difference between max and…
Q: The computer-science aptitude score, x, and the achievement score, y (measured by a comprehensive…
A: Let X be the computer science score Y be the achievement score
Q: The median home value in Michigan and New York (adjusted for inflation) are shown below. Year…
A:
Q: The table shows the number of vehicles 'y' that were cleaned at the car wash 'x' hours after the car…
A: From given data, X Y X*Y X*X 1 2 2 1 3 4 12 9 4 4 16 16 6 7 42 36 7 8 56 49 8 10 80…
Q: The following data refers to the amount of caffeine (in mg) consumed by ten university students and…
A: In the given scenario, we need to predict the time that students took to complete a practice exam…

Note: I want answer of part b only. Please solve with correct explanation. Solve within 40 minutes.

Step by step
Solved in 3 steps


- The following are data on the average weekly profits(in $1,000) of five restaurants, their seating capacities, andthe average daily traffic (in thousands of cars) that passestheir locations: Seating Traffic Weekly netcapacity count profitx1 x2 y120 19 23.8200 8 24.2150 12 22.0180 15 26.2240 16 33.5 (a) Assuming that the regression is linear, estimate β0, β1,and β2.(b) Use the results of part (a) to predict the averageweekly net profit of a restaurant with a seating capacityof 210 at a location where the daily traffic count averages14,000 cars.Consider the following regression equation representing the linear relationship between the Canada Child Benefit provided for a married couple with 3 children under the age of 6, based on their annual family net income: ŷ =121.09−0.57246xR2=0.894 where y = annual Canada Child Benefit paid (in $100s) x = net annual family income (in $1000s) Source: Canada Revenue Agency a. As the net annual family income increases, does the Canada Child Benefit paid increase or decrease? Based on this, is the correlation between the two variables positive or negative?The Canada Child Benefit paid .The correlation between the two variables is .b. Calculate the correlation coefficient and determine if the relationship between the two variables is strong, moderate or weak.r= , the relationship is . Round to 3 decimal places c. Interpret the value of the slope as it relates to this relationship. For every $1 increase in annual family net income, there is a $0.57246 decrease in…Consider the following regression equation representing the linear relationship between the Canada Child Benefit provided for a married couple with 3 children under the age of 6, based on their annual family net income: ŷ =121.09−0.57246xR2=0.894 where y= annual Canada Child Benefit paid (in $100s) x = net annual family income (in $1000s) Source: Canada Revenue Agency a. As the net annual family income increases, does the Canada Child Benefit paid increase or decrease? Based on this, is the correlation between the two variables positive or negative?The Canada Child Benefit paid ? .The correlation between the two variables is ? .b. Calculate the correlation coefficient and determine if the relationship between the two variables is strong, moderate or weak.r= , the relationship is ? . Round to 3 decimal places c. Interpret the value of the slope as it relates to this relationship. For every $1 increase in annual family net income, there is a $0.57246 decrease in…
- The following estimated regression model was developed relating yearly income (y in $1000s) of 30 individuals with their age (x1) and their gender (x2) (0 if male and 1 if female).ŷ = 30 + 0.7x1 + 3x2Also provided are SST = 1200 and SSE = 384.The yearly income of a 24-year-old female individual is _____.The table given below indicates New Holding Ltd.’s quarterly profits in 2019 and 2020.Time Period Profit (Thousands Of Rands)2019 Q1 2502019 Q2 2102019 Q3 1652019 Q4 1952020 Q1 2652020 Q2 2182020 Q3 1782020 Q4 204 Determine the trend regression function for this data set. Given that the typical seasonal index for Q3 is 87.3, use this informationand the trend regression function obtained to determine theseasonally adjusted trend estimate for profits in Q3 of 2022.The following table represents the survey result from the seven online stores. Use linear regression to find the linear equation that is best fit for the data, width x equal to the online advertising. Round your coefficient to three decimal places. Online Store Online Advertising (in thousand dollars) Monthly e-commerce Sales (in thousand dollars) 1 1.5 368 2 1.7 340 3 2.8 665 4 5 954 5 1.3 331 6 2.2 556 7 1.3 376
- The following table shows the annual number of PhD graduates in a country in various fields. NaturalSciences Engineering SocialSciences Education 1990 70 10 60 30 1995 130 40 120 50 2000 330 130 280 140 2005 490 370 460 210 2010 590 550 830 520 2012 690 590 1,000 900 (a) With x = the number of social science doctorates and y = the number of education doctorates, use technology to obtain the regression equation. (Round coefficients to three significant digits.) y(x) = Graph the associated points and regression line. (b) What does the slope tell you about the relationship between the number of social science doctorates and the number of education doctorates? The slope tells us the increase in the number of education doctorates for each additional social science doctorate.The slope tells us the decrease in the number of education doctorates for each additional social science doctorate. The slope tells us the increase in the number…The table given below indicates Small Holding Ltd.’s quarterly profits in 2019 and 2020.Time Period Profit (Thousands Of Rands)2019 Q1 2502019 Q2 2102019 Q3 1652019 Q4 1952020 Q1 2652020 Q2 2182020 Q3 1782020 Q4 204Q.6.3.1 Determine the trend regression function for this data set. In order to obtain full marks for this question, you must complete the relevanttable (template provided below) and then apply the appropriate timeseries formulae in the formulae sheet.Q.6.3.2 Given that the typical seasonal index for Q3 is 87.3, use this informationand the trend regression function obtained in Q.6.3.1 to determine theseasonally adjusted trend estimate for profits in Q3 of 2022.The following table shows the annual number of PhD graduates in a country in various fields. NaturalSciences Engineering SocialSciences Education 1990 70 10 70 30 1995 130 40 110 50 2000 330 130 280 140 2005 490 370 460 210 2010 590 550 830 520 2012 690 590 1,000 900 (a) With x = the number of social science doctorates and y = the number of education doctorates, use technology to obtain the regression equation. (Round coefficients to three significant digits.) y(x) = Graph the associated points and regression line. (b) What does the slope tell you about the relationship between the number of social science doctorates and the number of education doctorates? The slope tells us the increase in the number of social science doctorates for each additional education doctorate.The slope tells us the increase in the number of education doctorates for each additional social science doctorate. The slope tells us the decrease in the number…
- The following table indicates the ages of a sample of female employees of People Plus Pty, and the corresponding monthly income of each employee (in thousands of Rands). Age In Years (x) 404932273846 Monthly Income (R000s) (y) 434936314142 By completing the table given below, and then applying the relevant formulae, determine the linear regression function for this bivariate data set. X Y X^2 XY TOTAL If a female employee is 39 years of age, estimate her monthly income.In order to determine a realistic price for a new product that a company wants to market the company’s research department selected 10 sites thought to have essentially identical sales potential and offered the product in each at a different price. The resulting sales are recorded in the accompanying table: Price ($) Sales ($1,000s) 15.00 15 15.50 14 16.00 16 16.50 9 17.00 12 17.50 10 18.00 8 18.50 9 19.00 6 19.50 5 h). Estimate the slope of the actual equation of the regression line using a 95% confidence interval and interpret this interval.In order to determine a realistic price for a new product that a company wants to market the company’s research department selected 10 sites thought to have essentially identical sales potential and offered the product in each at a different price. The resulting sales are recorded in the accompanying table: Price ($) Sales ($1,000s) 15.00 15 15.50 14 16.00 16 16.50 9 17.00 12 17.50 10 18.00 8 18.50 9 19.00 6 19.50 5 h). Estimate the slope of the actual equation of the regression line using a 95% confidence interval and interpret this interval using Minitab.
