To investigate the relationship between yield of potatoes, y, and level of fertilizer application, x, a researcher divides a fieid into eight plots of equal size and applies differing amounts of fertilizer to each. The yield of potatoes (in pounds) and the fertilizer application (in pounds) are recorded for each plot. The data are as follows: I1 15 2 25 3.5 4. 4.5 35 32 34 3 |25 31 27 28 36 Find SX O 10.2 10.5 11.5 9.5 o000
To investigate the relationship between yield of potatoes, y, and level of fertilizer application, x, a researcher divides a fieid into eight plots of equal size and applies differing amounts of fertilizer to each. The yield of potatoes (in pounds) and the fertilizer application (in pounds) are recorded for each plot. The data are as follows: I1 15 2 25 3.5 4. 4.5 35 32 34 3 |25 31 27 28 36 Find SX O 10.2 10.5 11.5 9.5 o000

Elementary Geometry For College Students, 7e
7th Edition
ISBN:9781337614085
Author:Alexander, Daniel C.; Koeberlein, Geralyn M.
Publisher:Alexander, Daniel C.; Koeberlein, Geralyn M.
Chapter8: Areas Of Polygons And Circles
Section8.2: Perimeter And Area Of Polygons
Problem 34E: The farmer in Exercise 33 has decided to take the fencing purchased and use it to enclose the...

Related questions
Topic Video
Question
Plzzz explain. Ty
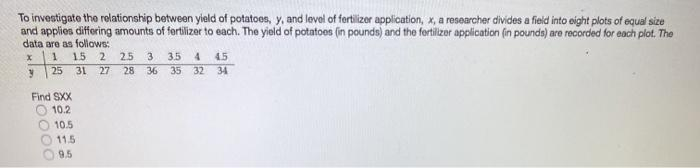
Transcribed Image Text:To investigate the relationship between yield of potatoes, y, and level of fertilizor application, x, a researcher divides a fieid into eight plots of equal size
and applies difforing amounts of fortilizer to each. The yield of potatoes (in pounds) and the fortilizor application (in pounds) are recorded for each plot. The
data are as foliows:
15
2.5
3
3.5 4 45
25 31
27
28
36
35 32 34
Find SXX
O 10.2
10.5
11.5
9.5
o000
Expert Solution
This question has been solved!
Explore an expertly crafted, step-by-step solution for a thorough understanding of key concepts.

Step by step
Solved in 3 steps

Knowledge Booster


Learn more about
Need a deep-dive on the concept behind this application? Look no further. Learn more about this topic, statistics and related others by exploring similar questions and additional content below.Recommended textbooks for you
Elementary Geometry For College Students, 7e
Geometry
ISBN:
9781337614085
Author:
Alexander, Daniel C.; Koeberlein, Geralyn M.
Publisher:
Cengage,

Holt Mcdougal Larson Pre-algebra: Student Edition…
Algebra
ISBN:
9780547587776
Author:
HOLT MCDOUGAL
Publisher:
HOLT MCDOUGAL

Functions and Change: A Modeling Approach to Coll…
Algebra
ISBN:
9781337111348
Author:
Bruce Crauder, Benny Evans, Alan Noell
Publisher:
Cengage Learning
Elementary Geometry For College Students, 7e
Geometry
ISBN:
9781337614085
Author:
Alexander, Daniel C.; Koeberlein, Geralyn M.
Publisher:
Cengage,
Holt Mcdougal Larson Pre-algebra: Student Edition…
Algebra
ISBN:
9780547587776
Author:
HOLT MCDOUGAL
Publisher:
HOLT MCDOUGAL
Functions and Change: A Modeling Approach to Coll…
Algebra
ISBN:
9781337111348
Author:
Bruce Crauder, Benny Evans, Alan Noell
Publisher:
Cengage Learning