b. Find the margin of error. E = lb (Round to five decimal places as needed.) c. Find the confidence interval estimate of μ. lb<μ
b. Find the margin of error. E = lb (Round to five decimal places as needed.) c. Find the confidence interval estimate of μ. lb<μ

Glencoe Algebra 1, Student Edition, 9780079039897, 0079039898, 2018
18th Edition
ISBN:9780079039897
Author:Carter
Publisher:Carter
Chapter10: Statistics
Section10.4: Distributions Of Data
Problem 19PFA

Related questions
Question

Transcribed Image Text:Here are summary statistics for the weights of Pepsi in randomly selected cans: n=36, x=0.82409 lb, s = 0.00567 lb.
Use a confidence level of 99% to complete parts (a) through (d) below.
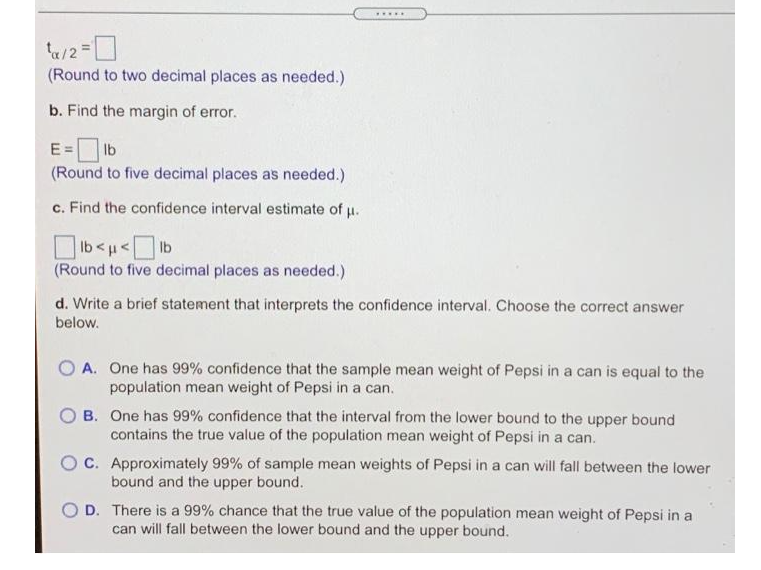
Transcribed Image Text:¹x/2 = 0
(Round to two decimal places as needed.)
b. Find the margin of error.
E = lb
(Round to five decimal places as needed.)
c. Find the confidence interval estimate of u.
lb<μ<
Ib
(Round to five decimal places as needed.)
*****
d. Write a brief statement that interprets the confidence interval. Choose the correct answer
below.
O A. One has 99% confidence that the sample mean weight of Pepsi in a can is equal to the
population mean weight of Pepsi in a can.
OB.
One has 99% confidence that the interval from the lower bound to the upper bound
contains the true value of the population mean weight of Pepsi in a can.
OC. Approximately 99% of sample mean weights of Pepsi in a can will fall between the lower
bound and the upper bound.
O D.
There is a 99% chance that the true value of the population mean weight of Pepsi in a
can will fall between the lower bound and the upper bound.
Expert Solution
This question has been solved!
Explore an expertly crafted, step-by-step solution for a thorough understanding of key concepts.

Step by step
Solved in 3 steps with 3 images

Recommended textbooks for you
Glencoe Algebra 1, Student Edition, 9780079039897…
Algebra
ISBN:
9780079039897
Author:
Carter
Publisher:
McGraw Hill
Glencoe Algebra 1, Student Edition, 9780079039897…
Algebra
ISBN:
9780079039897
Author:
Carter
Publisher:
McGraw Hill