B. Record the motion of a falling object. 1. Thread the ticker-tape through the vertically mounted timer, secure a mass to the tape and let it fall pulling the tape behind it. 2. Tabulate the average speed between consecutive ticks and plot. 3. Draw one straight line through the points representing the average slope. cm/tick tick Note: 4.6 14.0 23.3 * Timer frequency used is 10 ticks per second. 2 Plot this data on page #8, OT 1o vibrahons per 3 Second 32.6 42.2 51.6 4 * To Convert tick to second 5 to ticks = s %3D use scale Ihat fiks most of your Graph. 9i Label Your I tick %3D to 2 1 tiCK %3D l00 %3D I00 Axes. tick 2 innalor alternative method.
B. Record the motion of a falling object. 1. Thread the ticker-tape through the vertically mounted timer, secure a mass to the tape and let it fall pulling the tape behind it. 2. Tabulate the average speed between consecutive ticks and plot. 3. Draw one straight line through the points representing the average slope. cm/tick tick Note: 4.6 14.0 23.3 * Timer frequency used is 10 ticks per second. 2 Plot this data on page #8, OT 1o vibrahons per 3 Second 32.6 42.2 51.6 4 * To Convert tick to second 5 to ticks = s %3D use scale Ihat fiks most of your Graph. 9i Label Your I tick %3D to 2 1 tiCK %3D l00 %3D I00 Axes. tick 2 innalor alternative method.

College Physics
1st Edition
ISBN:9781938168000
Author:Paul Peter Urone, Roger Hinrichs
Publisher:Paul Peter Urone, Roger Hinrichs
Chapter16: Oscillatory Motion And Waves
Section: Chapter Questions
Problem 1PE: Fish ate hung on a spring scale to determine their mass (most fishermen feel no obligation to...

Related questions

Question
100%
Plot this data
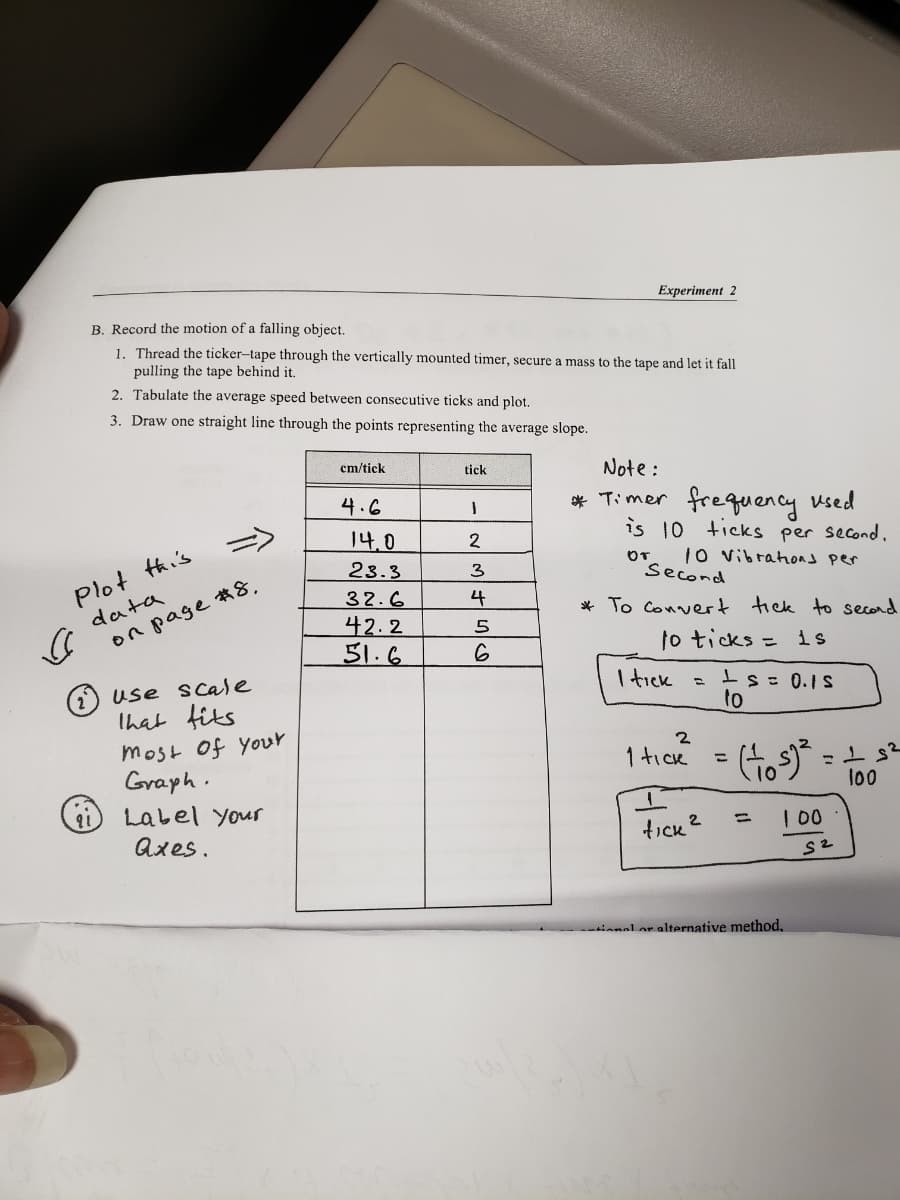
Transcribed Image Text:Еxperiment 2
B. Record the motion of a falling object,
1. Thread the ticker-tape through the vertically mounted timer, secure a mass to the tape and let it fall
pulling the tape behind it.
2. Tabulate the average speed between consecutive ticks and plot.
3. Draw one straight line through the points representing the average slope.
cm/tick
tick
Note :
frequency used
is 10 ticks per second.
4.6
* Timer
14.0
Plot thi's
data
on page ☆8,
1o vibrahons per
OT
23.3
3
Second
32.6
4
* To Convert tick to second
42.2
51.6
to ticks =
is
use scale
That fits
most of yor
Graph.
I tick
Is= 0.1S
to
2
1 tick =
lo0
Label Your
%3D
Axes.
tick?
innal or alternative method.
Expert Solution
This question has been solved!
Explore an expertly crafted, step-by-step solution for a thorough understanding of key concepts.

This is a popular solution!

Trending now
This is a popular solution!

Step by step
Solved in 2 steps with 1 images

Knowledge Booster


Learn more about
Need a deep-dive on the concept behind this application? Look no further. Learn more about this topic, physics and related others by exploring similar questions and additional content below.Recommended textbooks for you
College Physics
Physics
ISBN:
9781938168000
Author:
Paul Peter Urone, Roger Hinrichs
Publisher:
OpenStax College

Physics for Scientists and Engineers: Foundations…
Physics
ISBN:
9781133939146
Author:
Katz, Debora M.
Publisher:
Cengage Learning

Glencoe Physics: Principles and Problems, Student…
Physics
ISBN:
9780078807213
Author:
Paul W. Zitzewitz
Publisher:
Glencoe/McGraw-Hill
College Physics
Physics
ISBN:
9781938168000
Author:
Paul Peter Urone, Roger Hinrichs
Publisher:
OpenStax College
Physics for Scientists and Engineers: Foundations…
Physics
ISBN:
9781133939146
Author:
Katz, Debora M.
Publisher:
Cengage Learning
Glencoe Physics: Principles and Problems, Student…
Physics
ISBN:
9780078807213
Author:
Paul W. Zitzewitz
Publisher:
Glencoe/McGraw-Hill