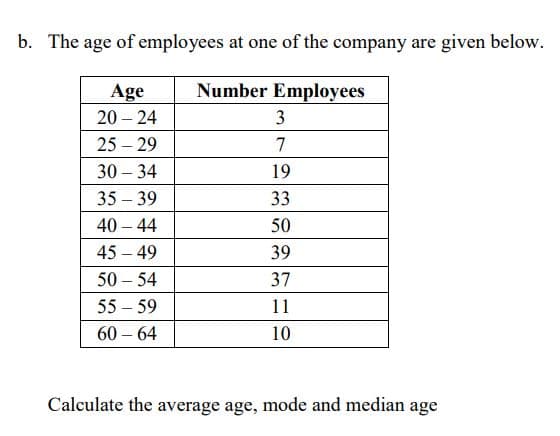
b. The age of employees at one of the company are given below. Age Number Employees 20 – 24 3 25 – 29 7 30 – 34 19 35 – 39 33 40 – 44 50 45 – 49 39 50 – 54 37 55 – 59 11 60 – 64 10 Calculate the average age, mode and median age


Q: A basketball coach believes that the variance of the heights of adult male basketball players is…
A: Given that Sample sizes n1=19 ,n2=18 Sample standard deviation s1=14.22 s2=34.49
Q: Using Excel, conduct a t-test (at the alpha = 0.01 significance level) on whether the mean of X2 is…
A:
Q: Solve the given problems. 1. For a t-distribution with 25 degrees of freedom, find the values of te…
A:
Q: Assume that the average weight of an NFL player is 245.7 lbs with a standard deviation of 34.5 lbs.…
A: Let X be the random variable from Normal distribution with mean (μ) = 245.7, standard deviation (σ)…
Q: An insurance company crashed four cars of the same model at 5 miles per hour The costs of repair for…
A: Data given 425,428,463,248
Q: An automotive engineer believes that her newly designed engine will be a great gas saver. A large…
A:
Q: Find the probability that the position of assistant professor is filled by a male applicant.
A: here given , The resumes of two male applicants for a college teaching position in Engineering Data…
Q: The height of the dogs in a pet shop is normally distributed with the average height of 25 cm and…
A:
Q: Let n = 60, p = 0.65, P = .35. Find p90 ?
A:
Q: The mean age of youth volunteers in a community project is 17.5 years with a standard deviation of 2…
A:
Q: The lifetime of a certain type of automobile tire (in thousands of miles) is normally distributed…
A:
Q: omplete the table given below
A: The sample mean of sampling distribution approaches normality according to the central limit…
Q: A teacher believes that 85% of students in the 2nd grade at her school will want to go to the zoo.…
A: Given Information: The teacher believes that 85% of students in the second grade will want to go to…
Q: Each year, researchers at the U.S. Bureau of Labor Statistics (BLS) administer the American Time Use…
A: A researcher complied a random sample of 12 Americans and asked each person how much time they spent…
Q: η Σ χ-Σx ν η Σ 2-(Σ x • m = O b = Ey-m x n η Σ w-ΣxΣy Οr x)- Regression Line : y = mx + b
A:
Q: The Economist collects data each year on the price of a Big Mac in various countries around the…
A: Population mean μ=5.04 Data given 4.47,3.16,2.41,3.95,4.34,4.49,4.20,3.70,4.63,3.77,3.34,3.86
Q: A variety of variables were measured for all tornadoes in the United States in 2017. (a) Since 1950,…
A:
Q: You want to obtain a sample to estimate how much parents spend on their kids birthday parties. Based…
A:
Q: SOLVE FOR THE FOLLOWING with complete solution: 1, 3, 4, 5, 5, 6, 8, 8, 8, 9 A. Mean B. Median…
A:
Q: 3. BROILER DIET STUDY A study aims to determine if a diet supplemented with phytase has a greater…
A: From the given information we find the solution.
Q: It is commonly held that around 15.7% of American college students regularly use marijuana. A…
A: Conditions for run a hypothesis test. sample size condition 10% condition and randomization…
Q: s hummingbird (Selasphorus sasin) has been studied by zoologist Bill Alther.† Suppose a small group…
A: Given n=13 Xbar=3.15 Standard deviation=0.22
Q: 64% of adults said that they approved of the death penalty in some circumstances. The newspaper took…
A:
Q: It is of interest to determine if the average drying time of a certain brand of latex paint is not…
A: The specified statements related to the nature of the population from which the latex paints have…
Q: The heights of NBA players are normally distributed, with an average height of 6'7" (i.e. 79…
A: Let X be the random variable from Normal distribution with mean (μ) = 6'7" = 79 inches standard…
Q: . Let X1, X2, . . . , X81 be a random sample from an unknown distribution. After observing this…
A:
Q: Consider the following data: 10,6,1,2,8,9 Calculate the value of the sample standard deviation.…
A:
Q: mble. Number with Wart Successfully Removed Treatment Liquid nitrogen freezing 103 60 Duct Tape 100…
A: Given, Forliquid nitrogen freezing: sample size (n1) = 103 x1 = 60 sample proportion (p1^) = x1/n1…
Q: MEGA 6 is one such game. In the game a player selects 6 numbers from 1 – 28. If you match all 6…
A: MEGA 6 is one such game. In a game, a player selects 6 numbers from 1-28. If you match all 6…
Q: A personality test has a subsection designed to assess the "honesty" of the test-taker. Suppose that…
A: Here, margin of error is 4 and standard deviation is 21. We will find sample to help of margin of…
Q: A local pasty company ran a taste test with 3 different pasty recipes. The study consisted of 60…
A: Choice of Statistical Test depends on several factors.
Q: Question content area bottom Part 1 R=$enter your response here (Round up to the nearest cent.)
A:
Q: A manufacturer claims that the mean amount of juice in its 16 ounce bottles is 16.1 ounces. A…
A:
Q: Researchers were interested in assessing the effects of a new treatment on seasonal affective…
A: For the given data MS subjects = ?
Q: b) The table below shows the ages and glucose levels of 6 indi Glucose Age (x) Level (y) 40 95 23 68…
A: Enter the data into the excel sheet as follows: Click on data>data analysis > regression.…
Q: Find the following probabilities for test scores X, for which the mean is 400 and the standard…
A: It is given that X follows N(mean = 400, SD = 90), then Z = (X - mean)/SD follows N(0,1) Note :…
Q: In clinical tests of the drug Lipitor (generic name, atorvastatin, 863 patients were treated with 10…
A: From the provided information, Sample size (n) = 863 From which 19 patients experienced flu…
Q: a. The content of brown sugar inside a packet is normally distributed with mean 250 grams and…
A: 3a) The mean is 250 grams and the standard deviation is 5 grams.
Q: C. Direction: Solve the given problem below. Write your answer and solution on the space provided.…
A:
Q: who are infected with the corona virus but are asymptomatic (show no signs of epidemiologist…
A: According to guidelines we solve only first question when given questions are different.
Q: 2. A diet needs to include at least 200 mg of Vitamin A and Vitamin B. These requirements are to be…
A: Hello thank you for the question. According to our honor code can answer only three parts at a time.…
Q: 4. n = 23, X = 80.6, s = 3.2, 95% confidence 5. n = 25, X = 92.8, s = 2.6, 99% confidence
A:
Q: A regression analysis between sales (in $1000) and price (in dollars) gives the following equation:…
A: We have given that The regression equation is, y^ = 40000 - 5x and r = 0.6
Q: The amount of time that people spend at Grover Hot Springs is normally distributed with a mean of 71…
A:
Q: Prof. X has been monitoring all stats students' anxiety levels by covertly measuring…
A: Option B
Q: Find the z values for each of the following x values for a normal distribution with mean = 30 and a…
A: a) Consider that the mean and standard deviation of a random variable x are µ and σ, respectively.…
Q: What percentage of hospitals provide at least some charity care? Based on a random sample of…
A: For the given data ( a ) x= ? % s= ? % ( b ) lower limit = ? %upper limit = ?…
Q: The quarterly retums for a group of 65 mutual funds with a mean of 1.3% and a standard deviation of…
A:
Q: The accompanying table contains the overall download and upload speeds in mbps for nine carriers in…
A:
Q: Determine the critical value(s) for a right-tailed hypothesis test for a mean with the given…
A:

Step by step
Solved in 3 steps with 3 images

- The following data are for the throughput, as measured by the number of wafer lots produced per day by different operators (A, B, C, and D) on different machines (each operator used each machine on two different days): Eighty-four working days were needed to collect the data. The numbers in parentheses refer to the days on which the results were obtained. For example, on the first day, operator A produced 17 lots using machine 2, and on the 84th day, operator A produced 18 lots using machine 5. On some days (such as the third day), more than one item of data was collected, and on other days (such as day 40), no data was collected. Analyze the data, stating all assumptions and conclusions.A random sample of 60 men is selected and classified according drinking water and physical activity lifestyle (Habit). Are water and physical activity Habits independent for this group. use a= 0.01, and calc.X^2= 57.25 and X^2 critical =88.379)At a meeting of information systems for regional offices of a national company, a survey was taken to determine the number of employees the officers supervise in the operation of their departments, where X is the number of employees overseen by each information systems officer. Table X_____________________ Frequency 1 _____________________7 2 _____________________5 3 _____________________11 4 _____________________8 5 _____________________9 Referring to the Table above, how many regional officers are represented in the survey results?
- Suppose that a customer is purchasing a car. He conducts an experiment in which he puts 10 gallons of gas in the car and drives it until it runs out of gas. He conducts this experiment 15 times on each car and records the number of miles driven. Full data set Car 1 216 243 205 242 239 297 295 172 270 251 165 310 265 316 278 Car 2 231 220 223 205 245 257 242 292 248 252 287 255 250 293 251 Median for Car 2 M=___________mi / 10 gal (Type an integer or decimal rounded to one decimal place as needed.) Range for Car 1 R=__________mi / 10 gal (Type an integer or decimal rounded to one decimal place as needed.) Range for Car 2 R=__________mi / 10 gal (Type an integer or decimal rounded to one decimal place as needed.) Sample standard deviation for Car 1 s=_________mi / 10 gal (Type an integer or decimal rounded to one decimal place as needed.) Sample standard deviation…The file contains the amount that a sample of nine customers spent for lunch ($) at a fast-food restaurant: 4.20 5.03 5.86 6.45 7.38 7.54 8.46 8.47 9.87 d. Compute for the rangeConsider the stem and leaf diagram below showing the numerical grade awarded (out of 350) to the students Stem-and Leaf of GradeAwarded N = z Leaf Unit = 10 5 0 12223 14 0 44555588 y 1 0001122233 (x) 1 55555556667889 12 2 12 2 666677777 3 3 234 What is the value of y
- The population of a certain city is shown in the following table during 1910 to 1950.Year 1910 1920 1930 1940 1950Population (in thousands) 23 45 30 48 60 Find the population increase betweenI. 1918 to 1920II. 1932 to 1936III. 1947 to 1950The national distribution of fatal work injuries in a country is shown in the table to the right under National %. You believe that the distribution of fatal work injuries is different in the western part of the country and randomly select 6231 fatal work injuries occurring in that region. At α=0.05 can you conclude that the distribution of fatal work injuries in the west is different from the national distribution? Complete parts a through d below. Cause National % Western Frequency Transportation 44% 2887 Equipment 18% 1158 Assaults 15% 804 Falls 13% 752 Harmful fumes 8% 535 Fires 2% 95 a. State H0 and Ha and identify the claim. What is the null hypothesis, H0? How do I set this whole problem up to get the correct answers?The file contains the amount that a sample of nine customers spent for lunch ($) at a fast-food restaurant: 4.20 5.03 5.86 6.45 7.38 7.54 8.46 8.47 9.87 e. Compute for coefficient of variation
- For unemployed persons in the United States, the average number of months ofunemployment at the end of December 2009 was approximately seven months(Bureau of Labor Statistics, January 2010). Suppose the following data are for aparticular region in upstate New York. The values in the first column show thenumber of months unemployed and the values in the second column show thecorresponding number of unemployed persons.MonthsUnemployedNumberUnemployed1 10292 16863 22694 26755 34876 46527 41458 35879 2325 10 1120Let x be a random variable indicating the number of months a person is unemployed.a. Use the data to develop an empirical discrete probability distribution for x.b. Show that your probability distribution satisfies the conditions for a validdiscrete probability distribution.c. What is the probability that a person is unemployed for two months or less?Unemployed for more than two months?d. What is the probability that a person is unemployed for more than sixmonths?Fill the chi square for Cross 1 and Cross 2 from the following data in the attached image: Cross 1: Phenotypes Ratio Observed Expected (O-E)2/E Totals X2 = Cross 2: Phenotypes Ratio Observed Expected (O-E)2/E Totals X2 =At a meeting of information systems for regional offices of a national company, a survey was taken to determine the number of employees the officers supervise in the operation of their departments, where X is the number of employees overseen by each information systems officer. Table X_____________________ Frequency 1 _____________________7 2 _____________________5 3 _____________________11 4 _____________________8 5 _____________________9 Referring to the Table above, across all of the regional offices, how many total employees were supervised by those surveyed?

