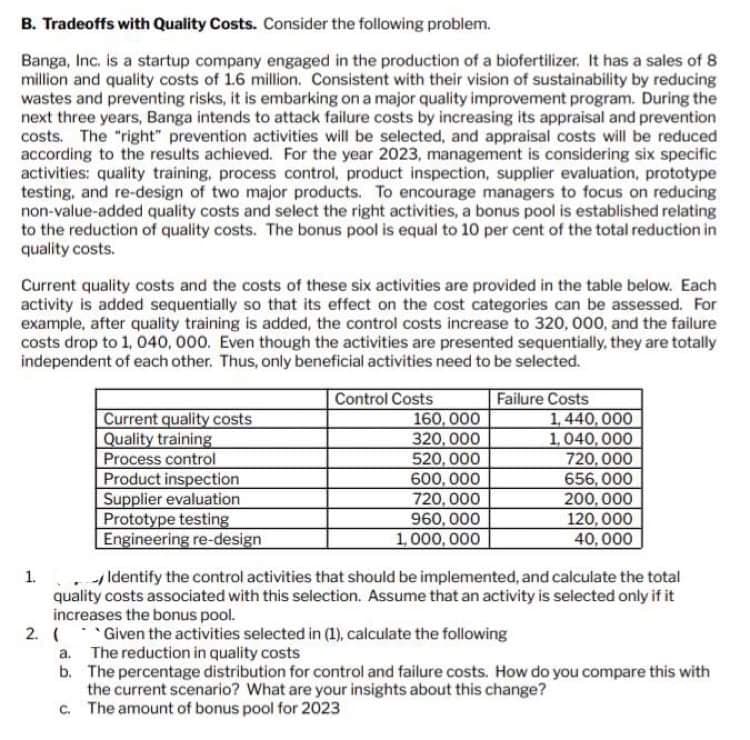
B. Tradeoffs with Quality Costs. Consider the following problem. Banga, Inc. is a startup company engaged in the production of a biofertilizer. It has a sales of 8 million and quality costs of 1.6 million. Consistent with their vision of sustainability by reducing wastes and preventing risks, it is embarking on a major quality improvement program. During the next three years, Banga intends to attack failure costs by increasing its appraisal and prevention costs. The "right" prevention activities will be selected, and appraisal costs will be reduced according to the results achieved. For the year 2023, management is considering six specific activities: quality training, process control, product inspection, supplier evaluation, prototype testing, and re-design of two major products. To encourage managers to focus on reducing non-value-added quality costs and select the right activities, a bonus pool is established relating to the reduction of quality costs. The bonus pool is equal to 10 per cent of the total reduction in quality costs. Current quality costs and the costs of these six activities are provided in the table below. Each activity is added sequentially so that its effect on the cost categories can be assessed. For example, after quality training is added, the control costs increase to 320, 000, and the failure costs drop to 1, 040, 000. Even though the activities are presented sequentially, they are totally independent of each other. Thus, only beneficial activities need to be selected. Control Costs 1. Current quality costs Quality training Process control Product inspection Supplier evaluation Prototype testing Engineering re-design 2. ( 160,000 320,000 520,000 600,000 720,000 960,000 1,000,000 a. The reduction in quality costs Failure Costs 1,440,000 1,040,000 Identify the control activities that should be implemented, and calculate the total quality costs associated with this selection. Assume that an activity is selected only if it increases the bonus pool. Given the activities selected in (1), calculate the following 720,000 656,000 200,000 120,000 40,000 b. The percentage distribution for control and failure costs. How do you compare this with the current scenario? What are your insights about this change? The amount of bonus pool for 2023 c.
B. Tradeoffs with Quality Costs. Consider the following problem. Banga, Inc. is a startup company engaged in the production of a biofertilizer. It has a sales of 8 million and quality costs of 1.6 million. Consistent with their vision of sustainability by reducing wastes and preventing risks, it is embarking on a major quality improvement program. During the next three years, Banga intends to attack failure costs by increasing its appraisal and prevention costs. The "right" prevention activities will be selected, and appraisal costs will be reduced according to the results achieved. For the year 2023, management is considering six specific activities: quality training, process control, product inspection, supplier evaluation, prototype testing, and re-design of two major products. To encourage managers to focus on reducing non-value-added quality costs and select the right activities, a bonus pool is established relating to the reduction of quality costs. The bonus pool is equal to 10 per cent of the total reduction in quality costs. Current quality costs and the costs of these six activities are provided in the table below. Each activity is added sequentially so that its effect on the cost categories can be assessed. For example, after quality training is added, the control costs increase to 320, 000, and the failure costs drop to 1, 040, 000. Even though the activities are presented sequentially, they are totally independent of each other. Thus, only beneficial activities need to be selected. Control Costs 1. Current quality costs Quality training Process control Product inspection Supplier evaluation Prototype testing Engineering re-design 2. ( 160,000 320,000 520,000 600,000 720,000 960,000 1,000,000 a. The reduction in quality costs Failure Costs 1,440,000 1,040,000 Identify the control activities that should be implemented, and calculate the total quality costs associated with this selection. Assume that an activity is selected only if it increases the bonus pool. Given the activities selected in (1), calculate the following 720,000 656,000 200,000 120,000 40,000 b. The percentage distribution for control and failure costs. How do you compare this with the current scenario? What are your insights about this change? The amount of bonus pool for 2023 c.

Practical Management Science
6th Edition
ISBN:9781337406659
Author:WINSTON, Wayne L.
Publisher:WINSTON, Wayne L.
Chapter2: Introduction To Spreadsheet Modeling
Section: Chapter Questions
Problem 20P: Julie James is opening a lemonade stand. She believes the fixed cost per week of running the stand...

Related questions
Question
Transcribed Image Text:B. Tradeoffs with Quality Costs. Consider the following problem.
Banga, Inc. is a startup company engaged in the production of a biofertilizer. It has a sales of 8
million and quality costs of 1.6 million. Consistent with their vision of sustainability by reducing
wastes and preventing risks, it is embarking on a major quality improvement program. During the
next three years, Banga intends to attack failure costs by increasing its appraisal and prevention
costs. The "right" prevention activities will be selected, and appraisal costs will be reduced
according to the results achieved. For the year 2023, management is considering six specific
activities: quality training, process control, product inspection, supplier evaluation, prototype
testing, and re-design of two major products. To encourage managers to focus on reducing
non-value-added quality costs and select the right activities, a bonus pool is established relating
to the reduction of quality costs. The bonus pool is equal to 10 per cent of the total reduction in
quality costs.
Current quality costs and the costs of these six activities are provided in the table below. Each
activity is added sequentially so that its effect on the cost categories can be assessed. For
example, after quality training is added, the control costs increase to 320, 000, and the failure
costs drop to 1, 040, 000. Even though the activities are presented sequentially, they are totally
independent of each other. Thus, only beneficial activities need to be selected.
1.
Current quality costs
Quality training
Process control
Product inspection
Supplier evaluation
Prototype testing
Engineering re-design
2. (
Control Costs
160,000
320,000
520,000
600,000
720,000
960,000
1,000,000
Failure Costs
1,440,000
1,040,000
- Identify the control activities that should be implemented, and calculate the total
quality costs associated with this selection. Assume that an activity is selected only if it
increases the bonus pool.
Given the activities selected in (1), calculate the following
720,000
656,000
200,000
120,000
40,000
a. The reduction in quality costs
b. The percentage distribution for control and failure costs. How do you compare this with
the current scenario? What are your insights about this change?
c. The amount of bonus pool for 2023
Expert Solution
This question has been solved!
Explore an expertly crafted, step-by-step solution for a thorough understanding of key concepts.

Step by step
Solved in 3 steps with 3 images

Recommended textbooks for you
Practical Management Science
Operations Management
ISBN:
9781337406659
Author:
WINSTON, Wayne L.
Publisher:
Cengage,

Operations Management
Operations Management
ISBN:
9781259667473
Author:
William J Stevenson
Publisher:
McGraw-Hill Education

Operations and Supply Chain Management (Mcgraw-hi…
Operations Management
ISBN:
9781259666100
Author:
F. Robert Jacobs, Richard B Chase
Publisher:
McGraw-Hill Education
Practical Management Science
Operations Management
ISBN:
9781337406659
Author:
WINSTON, Wayne L.
Publisher:
Cengage,
Operations Management
Operations Management
ISBN:
9781259667473
Author:
William J Stevenson
Publisher:
McGraw-Hill Education
Operations and Supply Chain Management (Mcgraw-hi…
Operations Management
ISBN:
9781259666100
Author:
F. Robert Jacobs, Richard B Chase
Publisher:
McGraw-Hill Education


Purchasing and Supply Chain Management
Operations Management
ISBN:
9781285869681
Author:
Robert M. Monczka, Robert B. Handfield, Larry C. Giunipero, James L. Patterson
Publisher:
Cengage Learning

Production and Operations Analysis, Seventh Editi…
Operations Management
ISBN:
9781478623069
Author:
Steven Nahmias, Tava Lennon Olsen
Publisher:
Waveland Press, Inc.