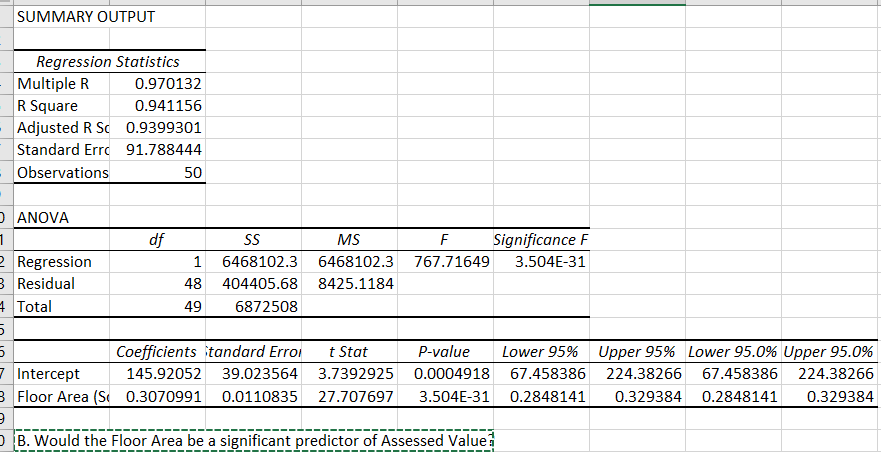
B. Would the Floor Area be a significant predictor of Assessed Value?


Q: A union restaurant and food-services worker would like to estimate the mean hourly wage.
A:
Q: Calculate t for a comparison for repeated-measures data?
A: The computational procedure is to compute the difference between each pair of observations (di)…
Q: The indicated IQ score, x, is
A: Let X represents the distribution of IQ scores. Given that X~N(mean= 100, SD= 15), then Z = (X -…
Q: Which type of data would best represent a numeric unemployment value? nominal O interval ordinal
A: The level of measurement is describes the classification of the nature of information of the values…
Q: What is a standard abbreviation for the mean?
A: Mean is a measure of center in case of quantitative data.
Q: What is the median nutritional status for the 7 individuals?
A: The number of nutritional status is 7.
Q: The ordinal level of measurement is represented in which variable below? race income IQ position in…
A: We know, there are four levels of measurements : i) Nominal ii) ordinal iii) interval iv) ratio.…
Q: What is the best estimate of the mean household income in this county?
A:
Q: What is the IQR for the data set?
A: Measure of central tendency measures the central or average value of a dataset. Measured of…
Q: which is more meaningful in ranking academic performance quartiles or deciles
A: A data set's quartiles divide the data into four equal parts, each containing one-fourth of the data…
Q: Explain four different levels of data measurement with an example for each
A: The four fundamental levels of measurement scales used to capture data in the form of surveys and…
Q: What is the mean of the current data set? Show your work using the sketchpad below.
A: Measure of central tendency measures the central or average value of a dataset. Measured of…
Q: Describe the process you would use to estimate Propensity Scores
A:
Q: Find the mean, variance, standard deviation, zscore of each variable.
A:
Q: Discuss why it is important to monitor forecast errors ?
A: Four reasons to track forecast accuracy:- 1.Improving your forecasting process requires the ability…
Q: Determine whether the following variables are qualitative or quantative, and explain why. Daily…
A: Qualitative variables take on values that are names or labels. For example: Hair color Quantitative…
Q: What can you say about the accuracy of the forecast for an earthquake?
A: Forecasting of an earthquake are used to establish codes of bulding, in awareness programs and in…
Q: Q) Estimate Median, Mean and standard deviation
A:
Q: What is the unit of observation in the dataset? A) The UK B) British Pound Sterling C) A person that…
A: given:The given survey is the smoking habits of the UK residents
Q: What is ordinal measurement?
A:
Q: Determine the: a. Range b. Mean c. Median
A: As per our guidelines, we are allowed to answer first three sub-parts. Thanks a) The data in…
Q: What is the distinctive property of ordinal measurement?
A: Introduction: There are broadly 4 scales of measurement used in Statistics, that either categorize…
Q: Determine whether the variables is qualitative or quantitative number of infants born in a month
A: Let QlV denote qualitative variable. Let QnV denote quantitative variable.
Q: The mean is another term for the ________ value of a data set.
A: Given, The mean is another term for the ________ value of a data set.
Q: The population mean, u, is a measure of
A: According to the given information, we havePopulation mean, μ is given.
Q: Which term describes a response that varies greatly from the majority of the other responses in…
A: An outlier is a value in a random sampling from a population that deviates abnormally from other…
Q: What is the value of the third decile in the following set of data? 27, 21, 22, 23, 15, 19, 20, 24,…
A: Since you have posted multiple questions and we can answer one question. So, answered the first…
Q: Use one example to explain why the level of measurement is the first thing needed to know in data…
A: The level of measurement is the first thing needed to know in data analysis. Examples are given…
Q: examine four levels of measurement?
A: There are four levels of measurement nominal ,ordinal and interval /ratio – with nominal being…
Q: What is the drawback of ordinal measurement?
A: The responses are often so narrow in reference to the question that they create or magnify bias…
Q: Use the data and the correct formula to find the margin of error for estimating a population…
A: Given: n = 100 x = 45 sample proportion = x / n = 45/100 =0.45 95% level of confidence Level of…
Q: Determine the median and mode from the histogram.
A: X Frequency 123 26 128 13 133 11 138 9 143 2 Solution: x(1) Frequency (f)(2) d=…
Q: the average score for an entire population is an example of
A: Solution: Parameter: Parameters is fixed value obtained from a all population or whole population.…
Q: It is a level of measurement for categorical data, where numbers are assigned to non-numeric data
A: We know that there are four levels of measurement, two are used for categorical data amd two are…
Q: if you were to describe a population or a basic data set, what measures/ graphics would you need and…
A: Theoretical Measures: (1). Central Tendency (mean, median, mode, etc.) describe where center or…
Q: What was the median commute time?
A: Here we want to know What was the median commute time.
Q: What is the point estimator of the population proportion, p
A: Point estimator is a statistic that is used to estimate the population parameter.
Q: Why the number of days spent in hospital is a data measured at an interval and not ordinal level?
A: Levels of measurement: Ordinal: It categorizes the objects with natural ordering or ranking.…
Q: Define the following terms and write down their formulas ? Statistics, Primary data, secondary…
A: Statistics It is a study of collection, manipulation and review of the data. It also involves the…
Q: How to find the relative and percent error in this data?
A: From the given data the equation is of linear type in the form of a line equation Y = a+bX The line…
Q: Is the following nominal, ordinal, or interval data? Explain your answer. Stock prices
A:
Q: State whether the following statement is true or false: “The correlation between bushels per acre…
A:
Q: Judging by the shape of the histogram, would it be appropriate to use the mean as the measure of the…
A: Mean and median gives the measure of central tendency of the data.Histogram shows the frequency of…
Q: Describe the shape of the data distribution and the location of the mean in relation to the median…
A: From the box-and-whisker plot, we see that the median is 7 First quartile= 5, third quartile= 11 The…
Q: Approximately, what percent of the data is less than the third quartile? O 75% O 0% 50% 25%
A:
Q: What is the level of Measurement and type of data?
A: Level of measurement describes the nature of data The four levels of measurement are : nominal,…
| B. Would the Floor Area be a significant predictor of Assessed Value? |


Trending now
This is a popular solution!

Step by step
Solved in 2 steps

- Characteristics Treatment Control P-value Mean SBP 115.3889± 113.0588±6.805 Mean difference (SBP) -0.66±3.0292 2.117 ±2.471 0.005347 Mean DBP 74.556± 7.366 72.4705±6.374 Mean difference (DBP) -1.888±2.9483 1.411765 ±3.3343 0.002233 Mean Pulse rate 96.222±13.0 88.94±15.43725 Mean difference -9.444± 0.5294118± 0.3529523 write an analysis for the data above and what does the p value mean?Analysis of Variance Source DF SS MS F P Regression 1 3390.0 3390.0 19.4 0.000 Residual Error 174 30397.8 174.7 Total 175 33787.8 Use the information in the table to give the sample size and to calculate R^2.Enter the exact answer for the sample size, and round R^2 to one decimal place.Enter your answer; n Enter your answer; R^2 %Conduct a global test on the set of independent variables. Interpret Regression Statistics Multiple R 0.87027387 R Square 0.75737661 Adjusted R Square 0.75615535 Standard Error 14.6932431 Observations 600 ANOVA df SS MS F Significance F Regression 3 401662.063 133887.354 620.160683 8.708E-183 Residual 596 128671.271 215.891394 Total 599 530333.333 Coefficients Standard Error t Stat P-value Lower 95% Upper 95% Lower 95.0% Upper 95.0% Intercept -3.9995369 3.05935528 -1.3073137 0.19161031 -10.007965 2.00889078 -10.007965 2.00889078 Annual Income 0.0002132 3.1402E-05 6.78944156 2.7269E-11 0.00015153 0.00027487 0.00015153 0.00027487 Married 45.7808695 1.20203164 38.0862434 8.444E-162 43.4201368 48.1416023 43.4201368 48.1416023 Male 21.9175699 1.20122625 18.2459964 2.0045E-59…
- Data: Rate difference per 1000 PY: ___-2.17__; 95% CI __-4.30___ to _-0.03____ HR: __79___; 95% CI _0.63____ to _0.99____ Which statement is the most correct interpretation of the risk of pooled stroke or systemic emboli in the propensity-matched analysis? Apixaban resulted in a statistically significant decrease in stroke or systemic emboli compared to rivaroxaban Apixaban resulted in a statistically significant increase in stroke or systemic emboli compared to rivaroxaban There was no statistically significant difference in stroke or systemic emboli between apixaban and rivaroxaban.Chest Injury Rating Car Driver Passenger Car Driver Passenger 1 42 35 10 36 37 2 42 35 11 36 37 3 34 45 12 43 58 4 34 45 13 40 42 5 45 45 14 43 58 6 40 42 15 37 41 7 42 46 16 37 41 8 43 58 17 44 57 9 45 43 18 42 42 Generate test results (α = .01) using data analysis (EXCEL).Analysis of Variance results: Where: Age > 5Responses: AgeFactors: Sex Response statistics by factor Sex n Mean Std. Dev. Std. Error female 121 10.490083 4.2222704 0.38384277 male 155 9.0806452 3.0091656 0.241702 ANOVA table Source DF SS MS F-Stat P-value Sex 1 134.98939 134.98939 10.466692 0.0014 Error 274 3533.79 12.897044 Total 275 3668.7794 Tukey HSD results (95% level) female subtracted from Difference Lower Upper P-value male -1.4094375 -2.2670907 -0.55178425 0.0014 In one complete sentence, interpret your confidence interval. Make sure in the interpretation it is clear the direction of the difference (i.e. which gender weighs more and by how much. Explain why a confidence interval provides more information to a tiger researcher than the results of a hypothesis test
- Title: Measures of variability: Grouped data activitySUMMARY OUTPUT Regression Statistics Multiple R 0.664798 R Square 0.441957 Adjusted R Square 0.376305 Standard Error 6.412199 Observations 20 ANOVA df SS MS F Significance F Regression 2 553.5729 276.7864 6.731793 0.007025498 Residual 17 698.9771 41.1163 Total 19 1252.55 Coefficients Standard Error t Stat P-value Lower 95% Upper 95% Intercept 26.6651 13.92768 1.91454 0.072535 -2.71974085 56.04995 X1 4.00929 1.1224 3.572068 0.002347 1.641232912 6.377348 X2 0.810165 0.477768 1.69573 0.108172 -0.19783686 1.818168 a. What can you say about the strength of this relationship for the model using the F test? Use α = .05. b. Is y significantly related to each independent variable? Use α = .05. c. Would your answer to b change if α = .001? If so, how? (3+4+3)Prenatal care Results of a 1996 American MedicalAssociation report about the infant mortality rate fortwins carried for the full term of a normal pregnancy areshown on the next page, broken down by the level ofprenatal care the mother had received.a) Is the overall rate the average of the other three rates?Should it be? Explain.b) Do these results indicate that adequate prenatal careis important for pregnant women? Explain.c) Do these results suggest that a woman pregnant withtwins should be wary of seeking too much medicalcare? Explain.
- A pharmaceutical company fills a drug which is in a powder form into a bottle. It has an automatedprocess consisting of a filling machine and a sealing unit. After filling the bottle, it is automaticallysealed with a metallic cap. To monitor the quality of the process, samples of size 5 are drawnperiodically from the process and the quantity filled is measured. The table below has data on 12such observations.Sample 1 2 3 4 51 9.21 8.87 8.71 9.08 9.342 9.06 8.97 9.13 8.46 8.853 9.35 8.95 9.20 9.03 8.444 9.21 8.71 9.05 9.35 8.875 9.01 9.17 9.21 9.05 9.536 8.74 8.35 8.50 9.06 8.897 9.21 9.05 9.00 8.78 9.238 9.15 9.20 9.23 9.15 9.069 8.98 8.81 8.90 9.13 9.0510 9.03 9.10 9.26 9.44 8.4811 9.49 9.05 9.12 8.88 8.9312 8.95 9.10 9.02 9.04 8.96(a) Establish the upper and lower control limits for the X bar chart and the R Chart(b) Construct a control chart and investigate if the process is in controlValues for setting the control charts are A2 = 0.577, D3 = 0, D4 = 2.114Critical Values: z0.005 = 2.575, z0.01 = 2.325, z0.025 = 1.96, z0.05 = 1.645, z0.1 = 1.282When d.f.=31: t0.005 = 2.744, t0.01 = 2.453, t0.025 = 2.040, t0.05 = 1.696 t0.1 = 1.309 In a random sample of 32 fossilized male femurs found at the Gronsalen Barrow, the meanweight was 10.2 oz and the standard deviation was 0.42 oz. Use a 0.01 significance level to test theclaim that the mean weight of the femurs of the males who lived there was 10.4 oz.Rates of return (annualized) in two investment portfolios are compared over the last 12 quarters. They are considered similar in safety, but portfolio B is advertised as being "less volatile." (a) At a= .025, does the sample show that portfolio A has significantly greater variance in rates than portfolio B? (b) At a=.25, is there a significant difference in the means? Reject the null hypothesis if the F calc >? Calculate the test statistic? Portfolio A: 5.11, 10.86, 12.44, 4.16, 5.59, 8.67, 7.70, 9.86, 9.64, 4.97, 11.60, 11.43 Portfolio B: 9.08, 8.70, 7.57, 6.19, 7.69, 7.03, 7.61, 7.76, 8.74, 8.89, 7.50, 9.88 1) Specify the decision rule. Reject the null hypothesis if Fcalc>____ 2) State the decision rule for .01 level if significance. Reject the null hypothesis if tcalc<____ or tcalc>____