B4. A company has collected and smoothened its historical yearly sales data of a product from 2015 up to 2021. The following table shows the sales and moving average figures. Year Sales Three-year moving Five-year moving (S thousands) average average 2015 2016 326.0 324.0 2017 344.0 2018 383.0 371.0 367.4 2019 B 389.0 E 2020 398.0 D -- 2021 428.0
B4. A company has collected and smoothened its historical yearly sales data of a product from 2015 up to 2021. The following table shows the sales and moving average figures. Year Sales Three-year moving Five-year moving (S thousands) average average 2015 2016 326.0 324.0 2017 344.0 2018 383.0 371.0 367.4 2019 B 389.0 E 2020 398.0 D -- 2021 428.0

Chapter12: Sequences, Series And Binomial Theorem
Section12.3: Geometric Sequences And Series
Problem 12.58TI: What is the total effect on the economy of a government tax rebate of $500 to each household in...

Related questions
Question
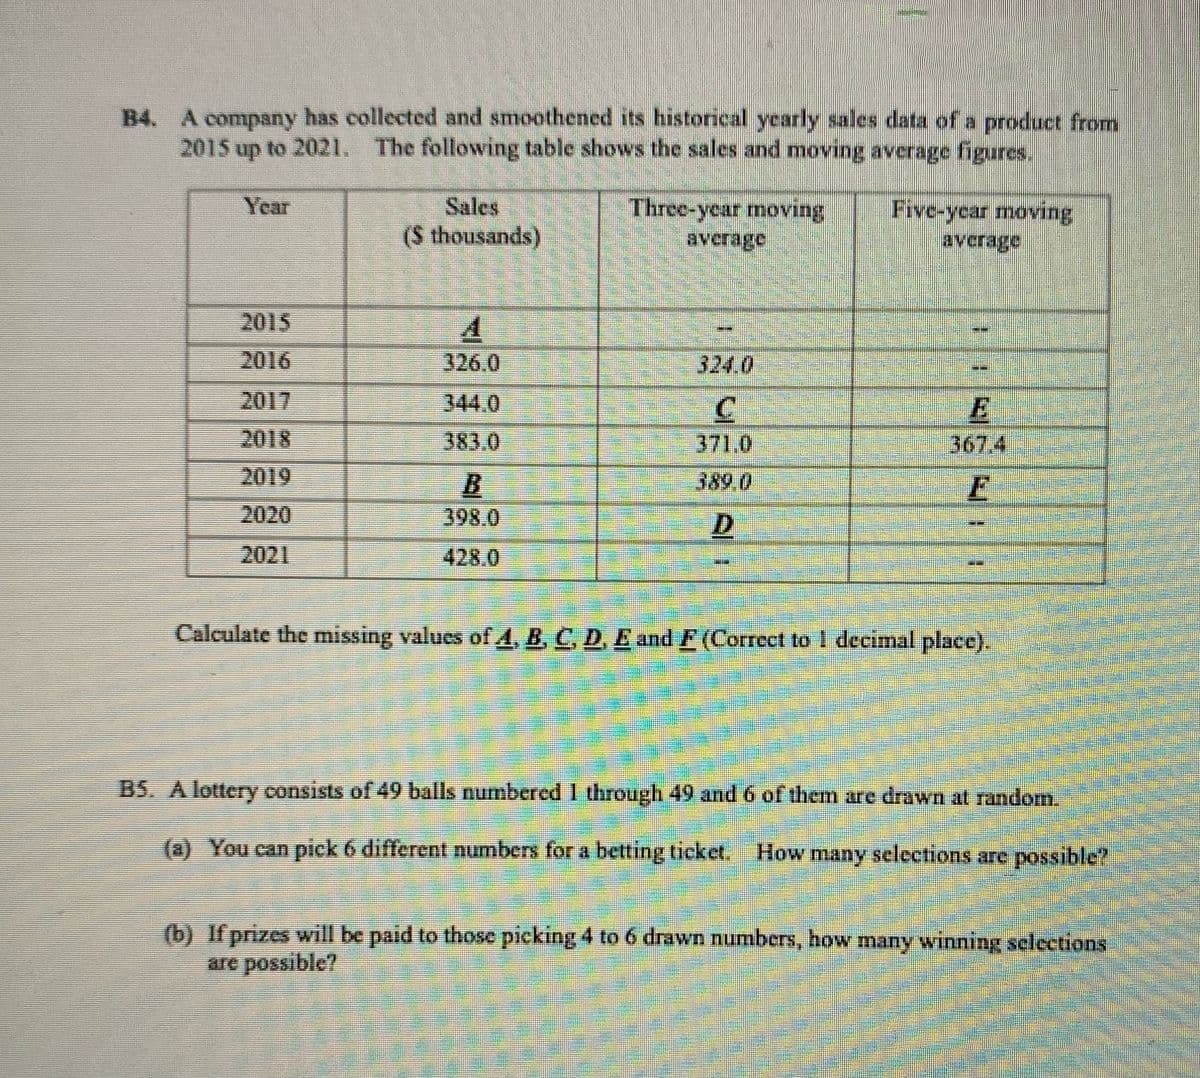
Transcribed Image Text:B4. A company has collected and smoothened its historical yearly sales data of a product from
2015 up to 2021. The following table shows the sales and moving average figures.
Sales
Three-year moving
avcrage
Year
Five-ycar moving
avcrage
(S thousands)
2015
2016
326.0
324.0
E
367.4
2017
344.0
2018
383.0
371.0
2019
B.
389.0
2020
398.0
D
2021
428.0
Calculate the missing values of4, B, C, D. E and F(Correct to I decimal place).
B5. A lottery consists of 49 balls numbered 1 through 49 and 6 of them are drawn at random.
(a) You can pick 6 different numbers for a betting ticket. How many selections are possible?
(b) If prizes will be paid to those picking 4 to 6 drawn numbers, how many winning selections
are possible?
ర
Expert Solution
This question has been solved!
Explore an expertly crafted, step-by-step solution for a thorough understanding of key concepts.

Step by step
Solved in 2 steps with 2 images

Recommended textbooks for you