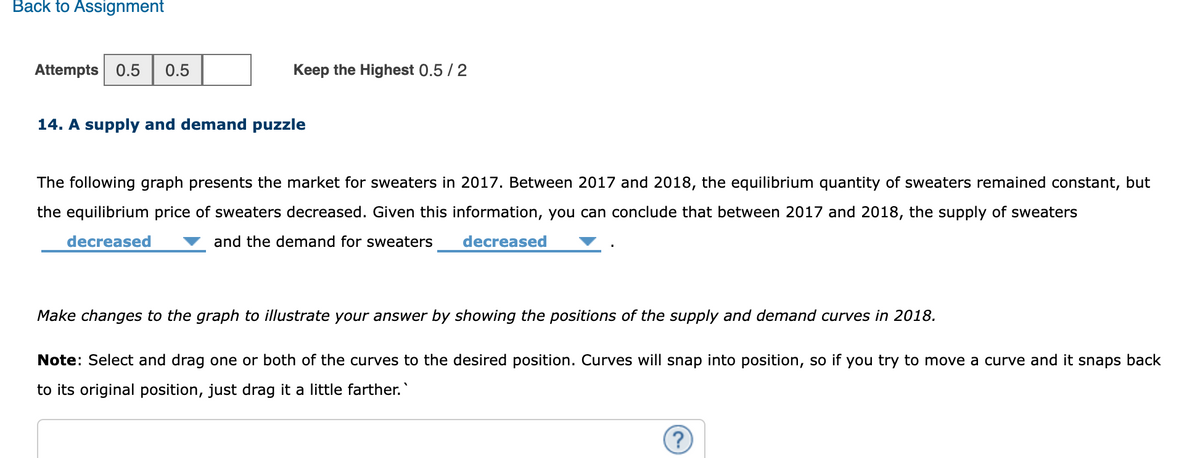
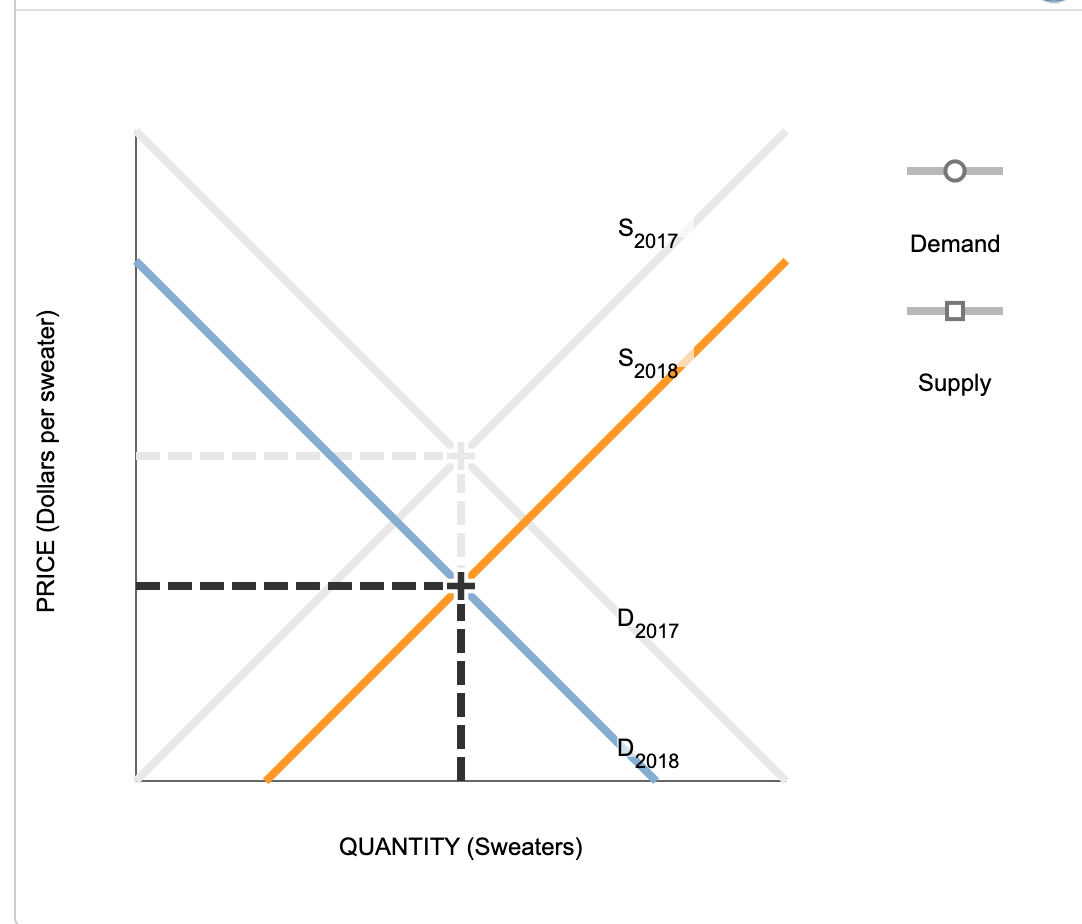
Back to Assignment Attempts 0.5 0.5 Keep the Highest 0.5 / 2 14. A supply and demand puzzle The following graph presents the market for sweaters in 2017. Between 2017 and 2018, the equilibrium quantity of sweaters remained constant, but the equilibrium price of sweaters decreased. Given this information, you can conclude that between 2017 and 2018, the supply of sweaters decreased and the demand for sweaters decreased Make changes to the graph to illustrate your answer by showing the positions of the supply and demand curves in 2018. Note: Select and drag one or both of the curves to the desired position. Curves will snap into position, so if you try to move a curve and it snaps back to its original position, just drag it a little farther."
Back to Assignment Attempts 0.5 0.5 Keep the Highest 0.5 / 2 14. A supply and demand puzzle The following graph presents the market for sweaters in 2017. Between 2017 and 2018, the equilibrium quantity of sweaters remained constant, but the equilibrium price of sweaters decreased. Given this information, you can conclude that between 2017 and 2018, the supply of sweaters decreased and the demand for sweaters decreased Make changes to the graph to illustrate your answer by showing the positions of the supply and demand curves in 2018. Note: Select and drag one or both of the curves to the desired position. Curves will snap into position, so if you try to move a curve and it snaps back to its original position, just drag it a little farther."

Economics Today and Tomorrow, Student Edition
1st Edition
ISBN:9780078747663
Author:McGraw-Hill
Publisher:McGraw-Hill
Chapter7: Demand And Supply
Section: Chapter Questions
Problem 20AA

Related questions
Question
The following graph presents the market for sweaters in 2017. Between 2017 and 2018, the equilibrium quantity of sweaters remained constant, but the equilibrium price of sweaters decreased. Given this information, you can conclude that between 2017 and 2018, the supply of sweatersdecreased and the demand for sweatersdecreased .
Make changes to the graph to illustrate your answer by showing the positions of the supply and demand curves in 2018.
Note: Select and drag one or both of the curves to the desired position. Curves will snap into position, so if you try to move a curve and it snaps back to its original position, just drag it a little farther.`
Transcribed Image Text:Back to Assignment
Attempts 0.5 0.5
Keep the Highest 0.5 / 2
14. A supply and demand puzzle
The following graph presents the market for sweaters in 2017. Between 2017 and 2018, the equilibrium quantity of sweaters remained constant, but
the equilibrium price of sweaters decreased. Given this information, you can conclude that between 2017 and 2018, the supply of sweaters
decreased
and the demand for sweaters
decreased
Make changes to the graph to illustrate your answer by showing the positions of the supply and demand curves in 2018.
Note: Select and drag one or both of the curves to the desired position. Curves will snap into position, so if you try to move a curve and it snaps back
to its original position, just drag it a little farther.
?
Transcribed Image Text:PRICE (Dollars per sweater)
QUANTITY (Sweaters)
S
2017
S2018
D2017
D 2018
Demand
Supply
Expert Solution
This question has been solved!
Explore an expertly crafted, step-by-step solution for a thorough understanding of key concepts.

This is a popular solution!

Trending now
This is a popular solution!

Step by step
Solved in 3 steps with 1 images

Knowledge Booster


Learn more about
Need a deep-dive on the concept behind this application? Look no further. Learn more about this topic, economics and related others by exploring similar questions and additional content below.Recommended textbooks for you
Economics Today and Tomorrow, Student Edition
Economics
ISBN:
9780078747663
Author:
McGraw-Hill
Publisher:
Glencoe/McGraw-Hill School Pub Co

Principles of Economics 2e
Economics
ISBN:
9781947172364
Author:
Steven A. Greenlaw; David Shapiro
Publisher:
OpenStax

Brief Principles of Macroeconomics (MindTap Cours…
Economics
ISBN:
9781337091985
Author:
N. Gregory Mankiw
Publisher:
Cengage Learning
Economics Today and Tomorrow, Student Edition
Economics
ISBN:
9780078747663
Author:
McGraw-Hill
Publisher:
Glencoe/McGraw-Hill School Pub Co
Principles of Economics 2e
Economics
ISBN:
9781947172364
Author:
Steven A. Greenlaw; David Shapiro
Publisher:
OpenStax
Brief Principles of Macroeconomics (MindTap Cours…
Economics
ISBN:
9781337091985
Author:
N. Gregory Mankiw
Publisher:
Cengage Learning

Exploring Economics
Economics
ISBN:
9781544336329
Author:
Robert L. Sexton
Publisher:
SAGE Publications, Inc


Microeconomics: Principles & Policy
Economics
ISBN:
9781337794992
Author:
William J. Baumol, Alan S. Blinder, John L. Solow
Publisher:
Cengage Learning