Background: Morris Saldov conducted a study in Eastern and Central Newfoundland in 1988 to examine public attitudes towards social spending. In particular, the study tried to determine if knowing someone on public assistance (yes, no) affected one's views on social spending (too little, about right, too much). The data from the study is summarized in the table below. Use a =0.05. Social Spending Total Too Little About Right Too Much Observed No 13 25 Count Public Assistance Observed Count Yes 39 16 64 Total Count 44 29 16 89 Source: Morris Saldov, Public Attitudes to Social Spending in Newfoundland," Canadian Review of Social Policy, 26, November 1990, pages 10-14. Directions: Conduct a chi-square test for independence to determine if the association between knowing someone on public assistance and views on social spending is statistically significant. 1. Choose the correct null and alternative hypotheses. O Họ: There is an association between knowing someone on public assistance and views on social spending. H. There is no association between knowing someone on public assistance and views on social spending. O Họ: There is no association between knowing someone on public assistance and views on social spending. H. There is an association between knowing someone on public assistance and views on social spending. 2. Compute the expected values. Complete the following table of expected counts. (Round your answers to 4 decimal places). Social Spending Total Too Little About Right Too Much Expected Count No Public 25
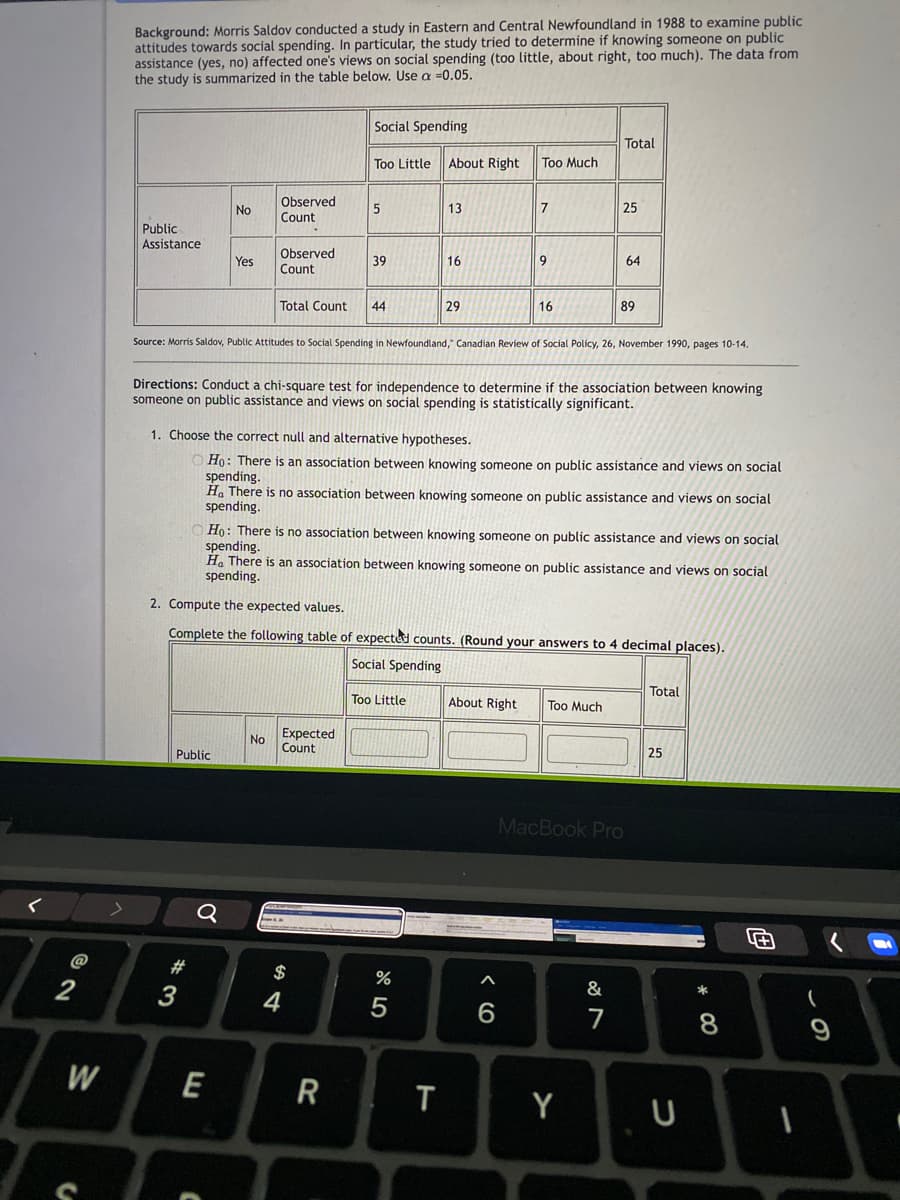
Background: Morris Saldov conducted a study in Eastern and Central Newfoundland in 1988 to examine public attitudes towards social spending. In particular, the study tried to determine if knowing someone on public assistance (yes, no) affected one's views on social spending (too little, about right, too much). The data from the study is summarized in the table below. Use a =0.05. Social Spending Total Too Little About Right Too Much Observed No 13 25 Count Public Assistance Observed Count Yes 39 16 64 Total Count 44 29 16 89 Source: Morris Saldov, Public Attitudes to Social Spending in Newfoundland," Canadian Review of Social Policy, 26, November 1990, pages 10-14. Directions: Conduct a chi-square test for independence to determine if the association between knowing someone on public assistance and views on social spending is statistically significant. 1. Choose the correct null and alternative hypotheses. O Họ: There is an association between knowing someone on public assistance and views on social spending. H. There is no association between knowing someone on public assistance and views on social spending. O Họ: There is no association between knowing someone on public assistance and views on social spending. H. There is an association between knowing someone on public assistance and views on social spending. 2. Compute the expected values. Complete the following table of expected counts. (Round your answers to 4 decimal places). Social Spending Total Too Little About Right Too Much Expected Count No Public 25
Holt Mcdougal Larson Pre-algebra: Student Edition 2012
1st Edition
ISBN:9780547587776
Author:HOLT MCDOUGAL
Publisher:HOLT MCDOUGAL
Chapter11: Data Analysis And Probability
Section11.5: Interpreting Data
Problem 9E
Related questions
Question

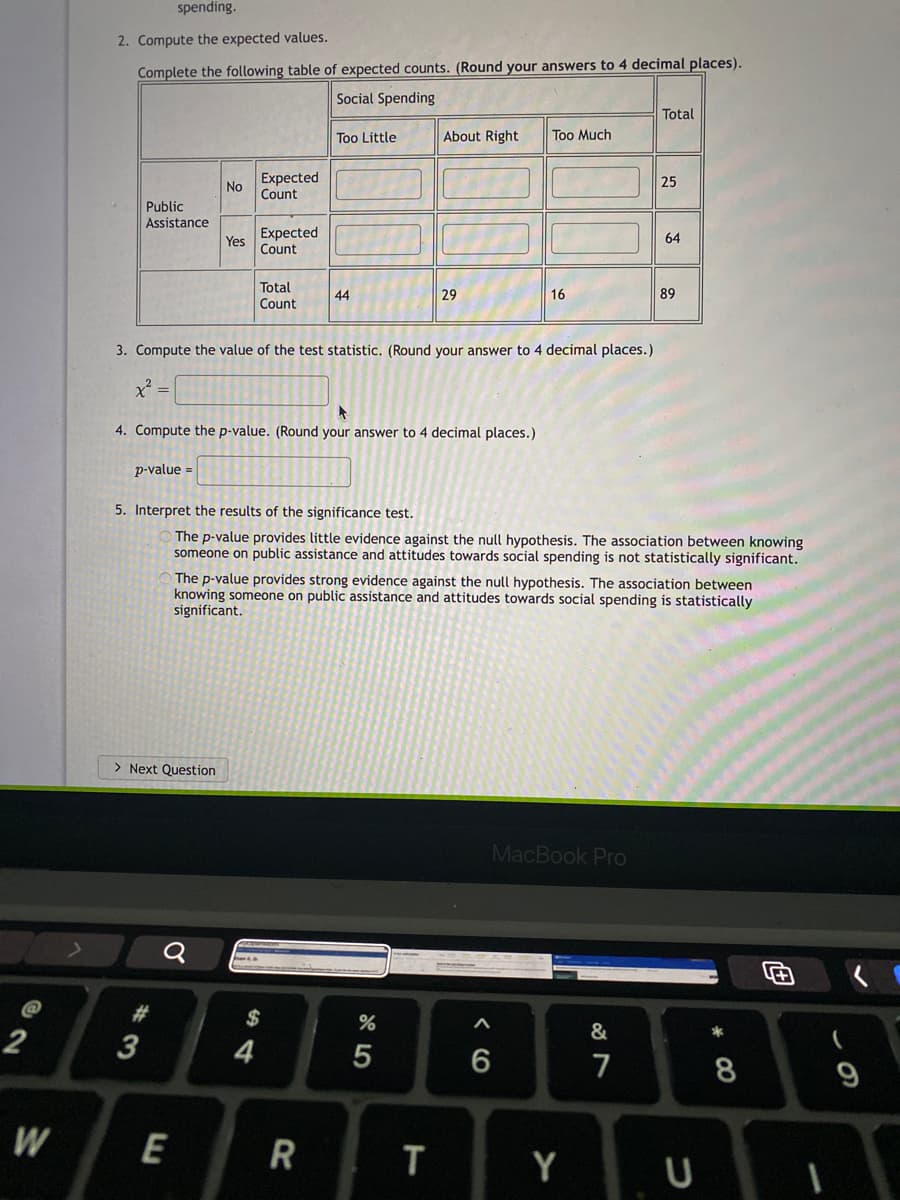
Transcribed Image Text:spending.
2. Compute the expected values.
Complete the following table of expected counts. (Round your answers to 4 decimal places).
Social Spending
Total
Too Little
About Right
Too Much
Expected
No
25
Count
Public
Assistance
Expected
Yes Count
64
Total
Count
44
29
16
89
3. Compute the value of the test statistic. (Round your answer to 4 decimal places.)
x =
4. Compute the p-value. (Round your answer to 4 decimal places.)
p-value =
5. Interpret the results of the significance test.
The p-value provides little evidence against the null hypothesis. The association between knowing
someone on public assistance and attitudes towards social spending is not statistically significant.
The p-value provides strong evidence against the null hypothesis. The association between
knowing someone on public assistance and attitudes towards social spending is statistically
significant.
> Next Question
MacBook Pro
Q
#
$
&
*
3
4
7
8
W
R
T
Y
U
< CO

Transcribed Image Text:Background: Morris Saldov conducted a study in Eastern and Central Newfoundland in 1988 to examine public
attitudes towards social spending. In particular, the study tried to determine if knowing someone on public
assistance (yes, no) affected one's views on social spending (too little, about right, too much). The data from
the study is summarized in the table below. Use a =0.05.
Social Spending
Total
Too Little
About Right
Too Much
Observed
Count
No
13
7
25
Public
Assistance
Observed
Yes
39
16
9.
64
Count
Total Count
44
29
16
89
Source: Morris Saldov, Public Attitudes to Social Spending in Newfoundland," Canadian Review of Social Policy, 26, November 1990, pages 10-14.
Directions: Conduct a chi-square test for independence to determine if the association between knowing
someone on public assistance and views on social spending is statistically significant.
1. Choose the correct null and alternative hypotheses.
O Ho: There is an association between knowing someone on public assistance and views on social
spending.
Ha There is no association between knowing someone on public assistance and views on social
spending.
O Ho: There is no association between knowing someone on public assistance and views on social
spending.
H. There is an association between knowing someone on public assistance and views on social
spending.
2. Compute the expected values.
Complete the following table of expected counts. (Round your answers to 4 decimal places).
Social Spending
Total
Too Little
About Right
Too Much
Expected
No
Count
Public
25
MacBook Pro
$
2
&
4
5
W
E
R
T
Y
CO
Expert Solution
This question has been solved!
Explore an expertly crafted, step-by-step solution for a thorough understanding of key concepts.
This is a popular solution!
Trending now
This is a popular solution!
Step by step
Solved in 2 steps with 3 images

Recommended textbooks for you

Holt Mcdougal Larson Pre-algebra: Student Edition…
Algebra
ISBN:
9780547587776
Author:
HOLT MCDOUGAL
Publisher:
HOLT MCDOUGAL

Glencoe Algebra 1, Student Edition, 9780079039897…
Algebra
ISBN:
9780079039897
Author:
Carter
Publisher:
McGraw Hill

Holt Mcdougal Larson Pre-algebra: Student Edition…
Algebra
ISBN:
9780547587776
Author:
HOLT MCDOUGAL
Publisher:
HOLT MCDOUGAL

Glencoe Algebra 1, Student Edition, 9780079039897…
Algebra
ISBN:
9780079039897
Author:
Carter
Publisher:
McGraw Hill