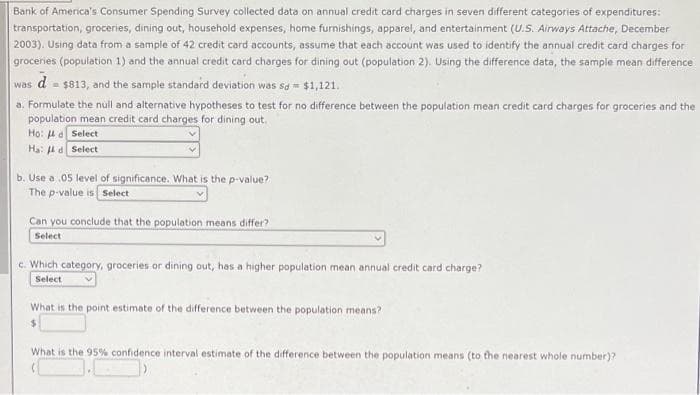
Bank of America's Consumer Spending Survey collected data on annual credit card charges in seven different categories of expenditures: transportation, groceries, dining out, household expenses, home furnishings, apparel, and entertainment (U.S. Airways Attache, December 2003). Using data from a sample of 42 credit card accounts, assume that each account was used to identify the annual credit card charges for groceries (population 1) and the annual credit card charges for dining out (population 2). Using the difference data, the sample mean difference was d = $813, and the sample standard deviation was sa = $1,121. a. Formulate the null and alternative hypotheses to test for no difference between the population mean credit card charges for groceries and the population mean credit card charges for dining out. Họ: 4a Select Hạ: l d Select b. Use a .05 level of significance. What is the p-value? The p-value is select Can you conclude that the population means differ? Select c. Which category, groceries or dining out, has a higher population mean annual credit card charge? Select What is the point estimate of the difference between the population means? What is the 95% confidence interval estimate of the difference between the population means (to the nearest whole number)?
Bank of America's Consumer Spending Survey collected data on annual credit card charges in seven different categories of expenditures: transportation, groceries, dining out, household expenses, home furnishings, apparel, and entertainment (U.S. Airways Attache, December 2003). Using data from a sample of 42 credit card accounts, assume that each account was used to identify the annual credit card charges for groceries (population 1) and the annual credit card charges for dining out (population 2). Using the difference data, the sample mean difference was d = $813, and the sample standard deviation was sa = $1,121. a. Formulate the null and alternative hypotheses to test for no difference between the population mean credit card charges for groceries and the population mean credit card charges for dining out. Họ: 4a Select Hạ: l d Select b. Use a .05 level of significance. What is the p-value? The p-value is select Can you conclude that the population means differ? Select c. Which category, groceries or dining out, has a higher population mean annual credit card charge? Select What is the point estimate of the difference between the population means? What is the 95% confidence interval estimate of the difference between the population means (to the nearest whole number)?

Glencoe Algebra 1, Student Edition, 9780079039897, 0079039898, 2018
18th Edition
ISBN:9780079039897
Author:Carter
Publisher:Carter
Chapter10: Statistics
Section10.6: Summarizing Categorical Data
Problem 10CYU

Related questions
Question
Transcribed Image Text:Bank of America's Consumer Spending Survey collected data on annual credit card charges in seven different categories of expenditures:
transportation, groceries, dining out, household expenses, home furnishings, apparel, and entertainment (U.S. Airways Attache, December
2003). Using data from a sample of 42 credit card accounts, assume that each account was used to identify the annual credit card charges for
groceries (population 1) and the annual credit card charges for dining out (population 2). Using the difference data, the sample mean difference
d -
= $813, and the sample standard deviation was sa = $1,121.
a. Formulate the null and alternative hypotheses to test for no difference between the population mean credit card charges for groceries and the
population mean credit card charges for dining out.
Họ: 4 a Select
Ha: 4d Select
was
b. Use a .05 level of significance. What is the p-value?
The p-value is Select
Can you conclude that the population means differ?
Select
c. Which category, groceries or dining out, has a higher population mean annual credit card charge?
Select
What is the point estimate of the difference between the population means?
%24
What is the 95% confidence interval estimate of the difference between the population means (to the nearest whole number)?
Expert Solution
This question has been solved!
Explore an expertly crafted, step-by-step solution for a thorough understanding of key concepts.

This is a popular solution!

Trending now
This is a popular solution!

Step by step
Solved in 2 steps with 1 images

Recommended textbooks for you
Glencoe Algebra 1, Student Edition, 9780079039897…
Algebra
ISBN:
9780079039897
Author:
Carter
Publisher:
McGraw Hill

Holt Mcdougal Larson Pre-algebra: Student Edition…
Algebra
ISBN:
9780547587776
Author:
HOLT MCDOUGAL
Publisher:
HOLT MCDOUGAL

College Algebra (MindTap Course List)
Algebra
ISBN:
9781305652231
Author:
R. David Gustafson, Jeff Hughes
Publisher:
Cengage Learning
Glencoe Algebra 1, Student Edition, 9780079039897…
Algebra
ISBN:
9780079039897
Author:
Carter
Publisher:
McGraw Hill
Holt Mcdougal Larson Pre-algebra: Student Edition…
Algebra
ISBN:
9780547587776
Author:
HOLT MCDOUGAL
Publisher:
HOLT MCDOUGAL
College Algebra (MindTap Course List)
Algebra
ISBN:
9781305652231
Author:
R. David Gustafson, Jeff Hughes
Publisher:
Cengage Learning
