Based on the data below, the relationship between Win and FG% is TEAM Win FG% 1Milwaukee Bucks 2Los Angeles LakersS 3Toronto Raptors 4LA Clippers 5Boston Celtics 6Denver Nuggets 7Utah Jazz 8Miami Heat 9Houston Rockets 90klahoma City Thunder 11Indiana Pacers 11Philadelphia 76ers 13Dallas Mavericks 14Memphis Grizzlies 15Brooklyn Nets 160rlando Magic 17Portland Trail Blazers 18New Orleans Pelicans 18Sacramento KingS 20San Antonio Spurs 21Phoenix Suns 22Washington Wizards 23Charlotte Hornets 24Chicago Bulls 25New York Knicks 26Detroit Pistons 27Atlanta Hawks 28Minnesota Timberwolves 29Cleveland Cavaliers 30Golden State Warriors O a.a very weak relationship O b. a weak relationship Oc.a moderate relationship d. a strong relationship e. a very strong relationship 53 47.7 49 48.5 46 45.8 44 46.4 43 45.9 43 47.1 41 47.5 41 47.0 40 45.4 40 47.3 39 47.7 39 46.5 40 46.2 32 47.0 30 44.4 30 44.2 29 46.1 28 46.2 28 45.9 27 47.0 26 46.4 24 46.1 23 43.4 22 44.7 21 44.7 20 45.9 20 44.9 19 44.1 19 45.8 15 43.8
Based on the data below, the relationship between Win and FG% is TEAM Win FG% 1Milwaukee Bucks 2Los Angeles LakersS 3Toronto Raptors 4LA Clippers 5Boston Celtics 6Denver Nuggets 7Utah Jazz 8Miami Heat 9Houston Rockets 90klahoma City Thunder 11Indiana Pacers 11Philadelphia 76ers 13Dallas Mavericks 14Memphis Grizzlies 15Brooklyn Nets 160rlando Magic 17Portland Trail Blazers 18New Orleans Pelicans 18Sacramento KingS 20San Antonio Spurs 21Phoenix Suns 22Washington Wizards 23Charlotte Hornets 24Chicago Bulls 25New York Knicks 26Detroit Pistons 27Atlanta Hawks 28Minnesota Timberwolves 29Cleveland Cavaliers 30Golden State Warriors O a.a very weak relationship O b. a weak relationship Oc.a moderate relationship d. a strong relationship e. a very strong relationship 53 47.7 49 48.5 46 45.8 44 46.4 43 45.9 43 47.1 41 47.5 41 47.0 40 45.4 40 47.3 39 47.7 39 46.5 40 46.2 32 47.0 30 44.4 30 44.2 29 46.1 28 46.2 28 45.9 27 47.0 26 46.4 24 46.1 23 43.4 22 44.7 21 44.7 20 45.9 20 44.9 19 44.1 19 45.8 15 43.8

Glencoe Algebra 1, Student Edition, 9780079039897, 0079039898, 2018
18th Edition
ISBN:9780079039897
Author:Carter
Publisher:Carter
Chapter10: Statistics
Section10.6: Summarizing Categorical Data
Problem 10CYU

Related questions
Question
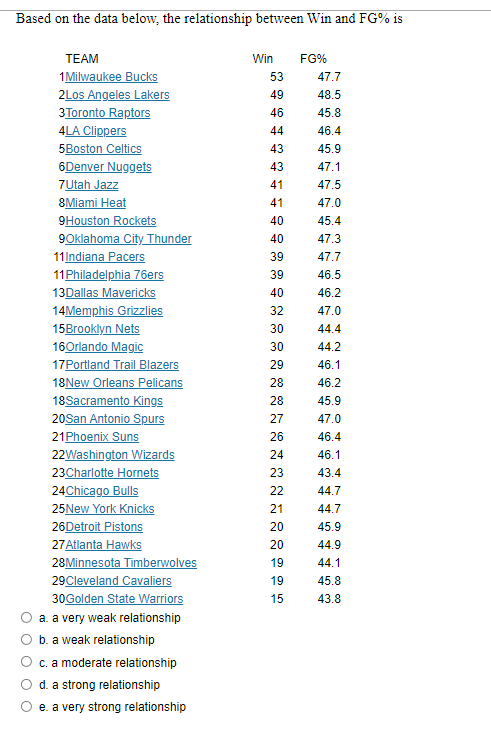
Transcribed Image Text:Based on the data below, the relationship between Win and FG% is
ТЕАМ
Win
FG%
1Milwaukee Bucks
2Los Angeles Lakers
3Toronto Raptors
4LA Clippers
5Boston Celtics
6Denver Nuggets
7Utah Jazz
8Miami Heat
9Houston Rockets
90klahoma City Thunder
11Indiana Pacers
11Philadelphia 76ers
13Dallas Mavericks
14Memphis Grizzlies
15Brooklyn Nets
160rlando Magic
17Portland Trail Blazers
18New Orleans Pelicans
18Sacramento Kings
20San Antonio Spurs
21Phoenix Suns
22Washington Wizards
23Charlotte Hornets
24Chicago Bulls
25New York Knicks
26Detroit Pistons
27Atlanta Hawks
28Minnesota Timberwolves
29Cleveland Cavaliers
30Golden State Warriors
53
47.7
49
48.5
46
45.8
44
46.4
43
45.9
43
47.1
41
47.5
41
47.0
40
45.4
40
47.3
39
47.7
39
46.5
40
46.2
32
47.0
30
44.4
30
44.2
29
46.1
28
46.2
28
45.9
27
47.0
26
46.4
24
46.1
23
43.4
22
44.7
21
44.7
20
45.9
20
44.9
19
44.1
19
45.8
15
43.8
a. a very weak relationship
b. a weak relationship
c. a moderate relationship
d. a strong relationship
e. a very strong relationship
Expert Solution
This question has been solved!
Explore an expertly crafted, step-by-step solution for a thorough understanding of key concepts.

Step by step
Solved in 2 steps with 1 images

Recommended textbooks for you
Glencoe Algebra 1, Student Edition, 9780079039897…
Algebra
ISBN:
9780079039897
Author:
Carter
Publisher:
McGraw Hill
Glencoe Algebra 1, Student Edition, 9780079039897…
Algebra
ISBN:
9780079039897
Author:
Carter
Publisher:
McGraw Hill