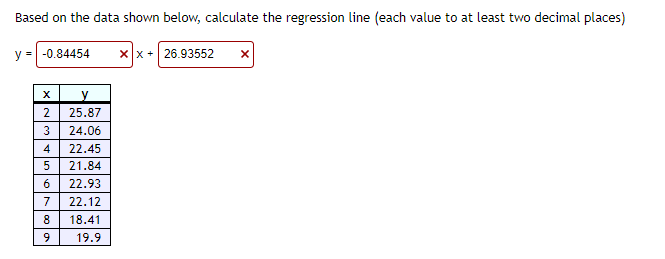
Based on the data shown below, calculate the regression line (each value to at least two decimal places) y = -0.84454 xx+ 26.93552 y 2 25.87 24.06 4 22.45 21.84 6 22.93 22.12 8 18.41


Q: In a city 20% of the cars are electric, 16% of the cars are red, and 13% of the cars are red…
A: From the given information, The probability of cars are electric is, 0.20 The probability of cars…
Q: 1-COSX Sin x Data Collection Techniques sinx F-2xya-1=1 ade in Ten Sind sinß sin?- 1. Census Data…
A: Census data collection Census data is taken by visiting each and every household and gathering…
Q: What is the importance of getting a sample from a population? When and why is it necessary?
A: The population is defined as a large group in which the units involved have the same…
Q: You want to obtain a sample to estimate a population proportion. At this point in time, you have no…
A:
Q: Find the P-value. P-value = (Round to three decimal places as needed.) Find the test statistic zo-
A: Given: n=500 x=410 α=0.1
Q: Let x be the size of a house (in square feet) and y be the amount of natural gas used (therms)…
A: Given that, x be the size of a house (in square feet) and y be the amount of natural gas used…
Q: Suppose that weight of adolescents is being studied by a health organization and that the…
A: Given X P(X) 0…
Q: Symmetric Measures Approximate Asymptotic Standard Error Approximate Significance Value Nominal by…
A:
Q: When a manned NASA spacecraft lands on Mars, the astronauts encounter a single adult Martian, who is…
A:
Q: Respondent Number Socio Economic Score in Mental Status(SES) (X) Ability 7.8 135 2 6.4 122 3 5.3 93…
A: For the given data Find What is the following: 1. Sum of X 2. Sum of Y 3. Sum of X2
Q: Craik and Lockhart (1972) proposed a model of memory that the degree to which verbal material is…
A: The objective is to test whether there is a difference in levels of processing influence ability to…
Q: Four distributions, labeled (a), (b), (c), and (d) are represented below by their histograms. Each…
A: See below
Q: Is npo (1-Po) 2 10? Select the correct choice below and fill in the answer box to complete your…
A:
Q: The researcher found a new medicine came out that can fatten and make the body healthy. Our group…
A: It is given that the sample size is 30.
Q: A regression was run to determine if there is a relationship between hours of TV watched per day (x)…
A: From the provided information, The results of the regression were: y = ax + b a = -1.346 b = 34.703…
Q: Among homeowners in a metropolitan area, 70% recycle plastic bottles each week. A waste management…
A: Given n=1700 P=0.70
Q: . Jordan operates a dental practice with 315 patients and she would like to estimate the proportion…
A: Given X=30 n=75 Significance level=1-0.90=0.10
Q: 9. Assume that a procedure yields a binomial distribution with a trial repeated n times. Use the…
A:
Q: Example 10.17 A population has a normal distribution with an unknown mean and a standard deviation O…
A:
Q: Describe the sampling distribution of p. Assume the size of the population is 15,000. n= 200, p =…
A:
Q: The t-test is a very useful parametric statistical test. Explain what the t-test is used for and…
A: T-test is used for single mean. Scenario 1: The Average math score in a college is 75. 25 students…
Q: A die is rolled 120 times to see if it is fair. The table below shows the outcomes. Face Value…
A: From the given information, the total number of observed frequencies is 120.
Q: Zombies have appeared in Chicago. Every day, each zombie produces 3 new zombies. Suppose that…
A:
Q: Suppose the Office of Career Services at UAPB wishes to study the career goals of the 21 year old…
A: The population is defined as a large group in which the units involved have the same…
Q: Simple linear regression results: Dependent Variable: Heart. Disease Independent Variable: Biking…
A: In this case, the dependent variable is Heart. Disease and the independent variable is Biking.
Q: How wil the MAGNITUDE of the crtical value for a two-tailed test compare to the critical value of…
A:
Q: The data referred to in this question were collected on 16 commercial tires. The copNY tires using…
A:
Q: What is the importance of collecting, organizing and presenting data? Minimum of 4 sentences.
A: From the given information we find the solution.
Q: maker of frozen meals claims that the average caloric content of its meals is 400. The standard…
A:
Q: QI. Define the Statistics.
A: Solution-: We define the statistics?
Q: Two professors at a local college developed a new teaching curriculum designed to increase students'…
A:
Q: When there is no significant difference among three or more means, the value of F will be close to…
A: Here we have given the statement about the F test. i.e. Analysis of variance We have to complete…
Q: The paired data below consists of test scores and hours of preparation for 5 randomly selected…
A: strong positive correlation.
Q: Sum of Mean F Ratio Source DE Prob > F Squares 8.35409 Square Model 1 88.3541 3.07 0.1104 10…
A: The independent variable is change in BMI. The dependent variable is measure of depression. We have…
Q: II. Enumeration. B. Levels of Measurement 1. 2 Examples of Nominal Measurement 2. 2 Examples of…
A: Level of measurement is vital to statistical analysis.
Q: The mean age when smokers first start is 13 years old with a population standard deviation of 2…
A: Given that Sample size n =31 Sample mean =12.1 Population standard deviation =2
Q: A simple random sample of 36 men from a normally distributed population results in a standard…
A: Given that, a simple random sample of 36 men from a normally distributed population results in a…
Q: he data to the right represent the number of chocolate chips per cookie in a random sample of a name…
A: For the given data Select the correct choices
Q: 2 questions 6 an
A: Y X 3 1 5 4 8 3 2 1 7 6 Regression Output using Excel for the line y = a+bx SUMMARY…
Q: A partial ANOVA table will be used to organize the values needed to compute a test statistic and the…
A: Here 4 treatments given We use ANOVA to get F-stastics and value. We have to answer only mentioned…
Q: Question 2 a) A particular study showed that 12 % of men will likely develop prostate cancer at some…
A: Hello. Since your question has multiple parts, we will solve first 3sub parts question for you. If…
Q: Español Oil and Gas Prices The average gasoline price per gallon (in cities) and the cost of a…
A:
Q: Solve 1 (xi - a)
A: According to the given information in this question We need to proof the given statement
Q: Using the given and computed values, is there a reason to believe that there is no significant…
A:
Q: In an experiment to investigate the performance of four different brands of spark plugs intended for…
A: The number of brands is r is 4.
Q: Randomly selected birth records were obtained, and categorized as listed in the table to the right.…
A: The categorical variable is day. We have to test whether births occur with the same frequency on the…
Q: Find the expected value of each random variable shown. a) x 0 1 2 P(X=x) 0.2 0.3 0.5…
A: Given,a) x 0 1 2 P(X=x) 0.2 0.3 0.5 and b) x 200 300…
Q: Two athletes are training for a cycling race. Each athlete recorded the distance (in miles) of their…
A: Given: Two athletes are training for a cycling race.
Q: For the data set shown below, complete parts (a) through (d) below. x| 20 30 40 50 600 y 102 95 93…
A: Use the Excel and Perform the Regression. Followings are the Steps to perform the Regression 1) Open…
Q: Test the hypothesis using the P-value approach. Be sure to verify the requirements of the test…
A: Consider that p is the true population proportion.


Trending now
This is a popular solution!

Step by step
Solved in 2 steps with 1 images

- BASED ON THIS DATA, what does the r^2 values tell you? and the linear regression line is the information statistically significant?Based on the results of the regression, what would be the mose likely conclusion?Based on the data shown below, calculate the regression line (each value to two decimal places)y = ____ x + ____ x y 3 7.16 4 8.68 5 6.6 6 9.82 7 9.84 8 9.36 9 7.38 10 9.2 11 9.02 12 9.44 13 7.66 14 7.88 15 8.6 16 8.02 17 6.94
- Given the partial results from a linear regression model below, a sample size of 504, and ɑ=0.05, What is the F-Statistic for the overall model? Is it statistically significant? What is the R2 for the regression model above?Using the regression line attached. Based on only the above plot, one can conclude: a) height causes an increase in weight b) weight causes an increase in height c) taller people are more likely to weigh more than shorter people, at least in the sample on which this data is based d) a statistically significant predictive relationship between height and weight e) c and dUse the sample linear regression line Y^=2+3X for the data points below to answer the following questions. X 0 3 7 10 Y 5 5 27 31 1) What is the fitted value when X2=3? 2) What is the regression residual when X2=3?
- If the standard error of the estimate for a regression model fitted to a large number of paired observations is 1.75, approximately 95% of the residuals would lie within ______. −3.50 and +3.50 −1.75 and +1.75 −0.95 and +0.95 −0.68 and +0.68 −0.97 and +0.97Based on the data shown below, calculate the regression line (each value to at least two decimal places)y = ____x + ______ x y 1 0.21 2 0.62 3 4.13 4 2.24 5 4.25 6 1.06which of the following regressions represents the strongest negative linear relationship between x and y? (Attached in picture provided)
- The following calculation have been made for the price of 12 stocks(x) on NSEo on a certain day along with volume of sales on share (y) . From these calculations.calculatep the regression equation of price of stocks on volume of shares sigma X=580, sigma Y= 370, sigma XY=11494, sigma X square=41658 Sigma Y square = 17206 ?Use these data and multiple regression to make predictions of the motel chain’s revenues during the next four quarters. Assume that advertising during each of the next four quarters is $50,000A sample of X and Y scores is taken, and a regression line is used to predict Y from X. If SSY' = 300, SSE = 500, and N = 50, what is(a) SSY?(b) the standard error of the estimate?(c) R2?