The data referred to in this question were collected on 16 commercial tires. The copNY tires using the weight method WM. The SAS regression output is given below as well as some summary measures rying Ead wear of commerci Analysis of Variance Sum of DF Mean Square F Value Pr > F Source Squares Model 84988 84988 .0001 Error 14 9615.88126 686.84866 Corrected 15 94604 Total Model Summary Root MSE 26.20780 R-Square 0.8984 Dependent Mean 236.00000 Adj R-Sq 0.8911 Coeff Var 11.10500 Parameter Estimates Parameter Standard Variable DF t Value Pr > |t| Estimate Error Intercept 1 13.50586 21.04761 0.64 0.5314 WM 1 0.79021 0.07104 11.12 <0.0001 What is the equation of the least squares regression line? 04-0.79021 WM+ 13.50586 09 13.50586 WM 0.79021 O9-0.79021+13.50586 09-0.79021 WM 13.50586
The data referred to in this question were collected on 16 commercial tires. The copNY tires using the weight method WM. The SAS regression output is given below as well as some summary measures rying Ead wear of commerci Analysis of Variance Sum of DF Mean Square F Value Pr > F Source Squares Model 84988 84988 .0001 Error 14 9615.88126 686.84866 Corrected 15 94604 Total Model Summary Root MSE 26.20780 R-Square 0.8984 Dependent Mean 236.00000 Adj R-Sq 0.8911 Coeff Var 11.10500 Parameter Estimates Parameter Standard Variable DF t Value Pr > |t| Estimate Error Intercept 1 13.50586 21.04761 0.64 0.5314 WM 1 0.79021 0.07104 11.12 <0.0001 What is the equation of the least squares regression line? 04-0.79021 WM+ 13.50586 09 13.50586 WM 0.79021 O9-0.79021+13.50586 09-0.79021 WM 13.50586

MATLAB: An Introduction with Applications
6th Edition
ISBN:9781119256830
Author:Amos Gilat
Publisher:Amos Gilat
Chapter1: Starting With Matlab
Section: Chapter Questions
Problem 1P

Related questions
Question
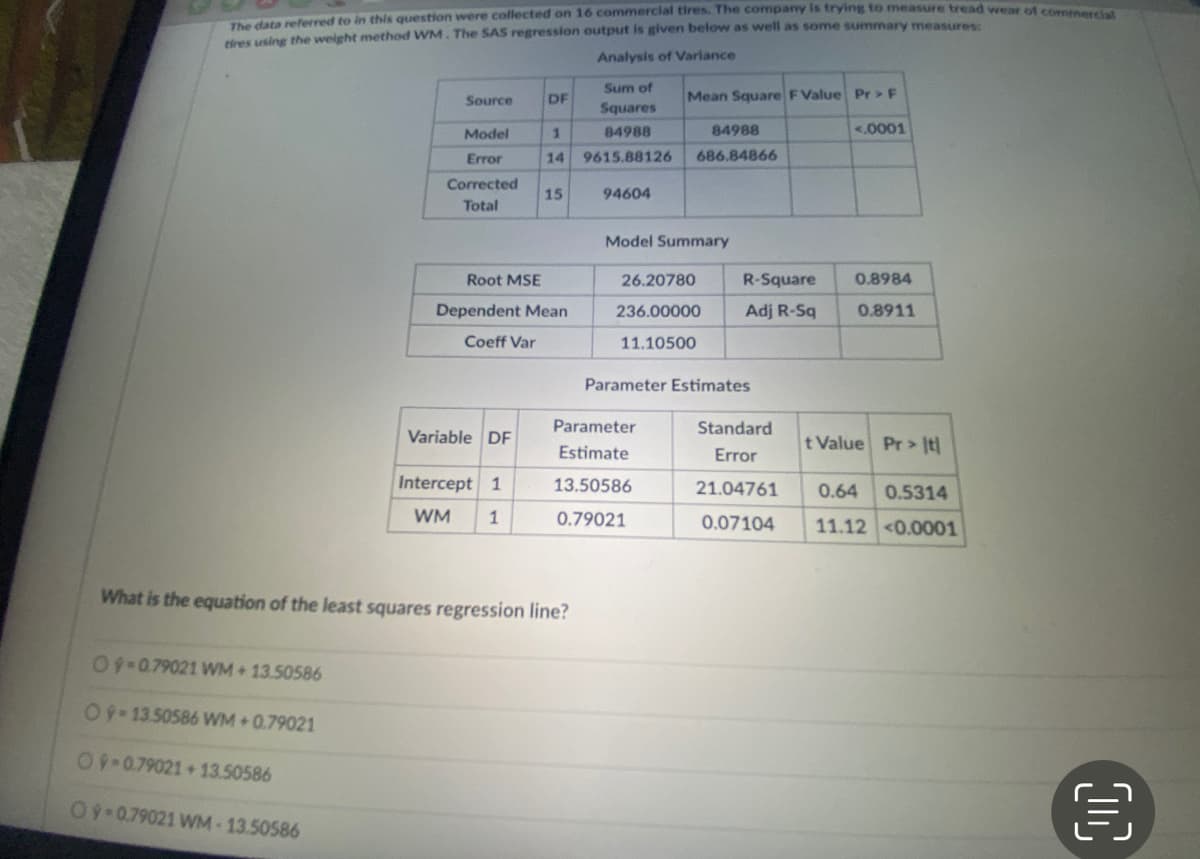
Transcribed Image Text:NA elered to in this question were collected on 16 commercial tires. The company is trying to measure tread wear t c
tires using the weight method WM. The SAS regression output is given below as well as some summary measures:
Analysis of Variance
Sum of
Source
DF
Mean Square F Value Pr > F
Squares
Model
84988
84988
<.0001
Error
14
9615.88126
686.84866
Corrected
15
94604
Total
Model Summary
Root MSE
26.20780
R-Square
0.8984
Dependent Mean
236.00000
Adj R-Sq
0.8911
Coeff Var
11.10500
Parameter Estimates
Parameter
Standard
Variable DF
t Value Pr > It|
Estimate
Error
Intercept 1
13.50586
21.04761
0.64
0.5314
WM
1
0.79021
0.07104
11.12 <0.0001
What is the equation of the least squares regression line?
O9-0.79021 WM+ 13.50586
09.13.50586 WM + 0.79021
09-0.79021+13.50586
09-0.79021 WM 13.50586
Expert Solution
This question has been solved!
Explore an expertly crafted, step-by-step solution for a thorough understanding of key concepts.

This is a popular solution!

Trending now
This is a popular solution!

Step by step
Solved in 2 steps with 2 images

Recommended textbooks for you
MATLAB: An Introduction with Applications
Statistics
ISBN:
9781119256830
Author:
Amos Gilat
Publisher:
John Wiley & Sons Inc

Probability and Statistics for Engineering and th…
Statistics
ISBN:
9781305251809
Author:
Jay L. Devore
Publisher:
Cengage Learning

Statistics for The Behavioral Sciences (MindTap C…
Statistics
ISBN:
9781305504912
Author:
Frederick J Gravetter, Larry B. Wallnau
Publisher:
Cengage Learning
MATLAB: An Introduction with Applications
Statistics
ISBN:
9781119256830
Author:
Amos Gilat
Publisher:
John Wiley & Sons Inc
Probability and Statistics for Engineering and th…
Statistics
ISBN:
9781305251809
Author:
Jay L. Devore
Publisher:
Cengage Learning
Statistics for The Behavioral Sciences (MindTap C…
Statistics
ISBN:
9781305504912
Author:
Frederick J Gravetter, Larry B. Wallnau
Publisher:
Cengage Learning

Elementary Statistics: Picturing the World (7th E…
Statistics
ISBN:
9780134683416
Author:
Ron Larson, Betsy Farber
Publisher:
PEARSON

The Basic Practice of Statistics
Statistics
ISBN:
9781319042578
Author:
David S. Moore, William I. Notz, Michael A. Fligner
Publisher:
W. H. Freeman

Introduction to the Practice of Statistics
Statistics
ISBN:
9781319013387
Author:
David S. Moore, George P. McCabe, Bruce A. Craig
Publisher:
W. H. Freeman