Based on the following regression equation of teenage BMI, which one is the estimated BMI for a teenage male (male: gender=0; female: gender=1) who watches 8 hours of TV per day, eats 6 meals per day, and whose mother's BMI is 17? BMI = 3.5 + 1.01 * Gender + 1.03 * TV/day + 1.02 * Meals/day + 0.9 * MotherBMI
Based on the following regression equation of teenage BMI, which one is the estimated BMI for a teenage male (male: gender=0; female: gender=1) who watches 8 hours of TV per day, eats 6 meals per day, and whose mother's BMI is 17? BMI = 3.5 + 1.01 * Gender + 1.03 * TV/day + 1.02 * Meals/day + 0.9 * MotherBMI

Functions and Change: A Modeling Approach to College Algebra (MindTap Course List)
6th Edition
ISBN:9781337111348
Author:Bruce Crauder, Benny Evans, Alan Noell
Publisher:Bruce Crauder, Benny Evans, Alan Noell
Chapter5: A Survey Of Other Common Functions
Section5.6: Higher-degree Polynomials And Rational Functions
Problem 1TU: The following fictitious table shows kryptonite price, in dollar per gram, t years after 2006. t=...

Related questions
Question
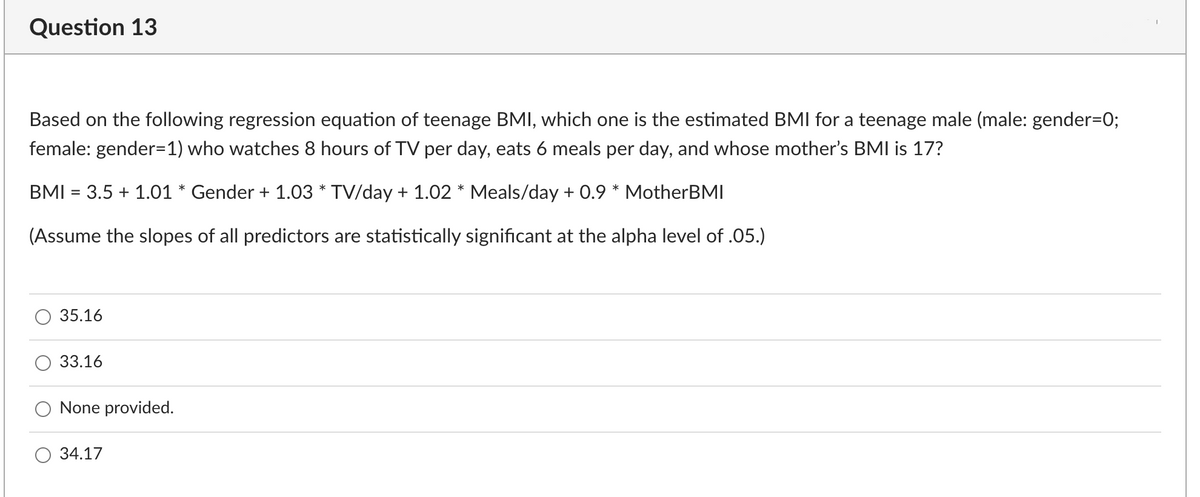
Transcribed Image Text:Question 13
Based on the following regression equation of teenage BMI, which one is the estimated BMI for a teenage male (male: gender=0;
female: gender=1) who watches 8 hours of TV per day, eats 6 meals per day, and whose mother's BMI is 17?
BMI = 3.5 + 1.01 * Gender + 1.03 * TV/day + 1.02 * Meals/day + 0.9 * MotherBMI
(Assume the slopes of all predictors are statistically significant at the alpha level of .05.)
35.16
33.16
None provided.
34.17
Expert Solution
This question has been solved!
Explore an expertly crafted, step-by-step solution for a thorough understanding of key concepts.

This is a popular solution!

Trending now
This is a popular solution!

Step by step
Solved in 2 steps with 2 images

Recommended textbooks for you
Functions and Change: A Modeling Approach to Coll…
Algebra
ISBN:
9781337111348
Author:
Bruce Crauder, Benny Evans, Alan Noell
Publisher:
Cengage Learning

Glencoe Algebra 1, Student Edition, 9780079039897…
Algebra
ISBN:
9780079039897
Author:
Carter
Publisher:
McGraw Hill

Functions and Change: A Modeling Approach to Coll…
Algebra
ISBN:
9781337111348
Author:
Bruce Crauder, Benny Evans, Alan Noell
Publisher:
Cengage Learning
Glencoe Algebra 1, Student Edition, 9780079039897…
Algebra
ISBN:
9780079039897
Author:
Carter
Publisher:
McGraw Hill

College Algebra
Algebra
ISBN:
9781305115545
Author:
James Stewart, Lothar Redlin, Saleem Watson
Publisher:
Cengage Learning