Based on the given data, construct and evaluate the calibration curve by plotting absorbance versus concentration. Calculate the mean concentration of Copper and Chromium in the unknown tap water sample
Based on the given data, construct and evaluate the calibration curve by plotting absorbance versus concentration. Calculate the mean concentration of Copper and Chromium in the unknown tap water sample

Chemistry: Principles and Reactions
8th Edition
ISBN:9781305079373
Author:William L. Masterton, Cecile N. Hurley
Publisher:William L. Masterton, Cecile N. Hurley
Chapter1: Matter And Measurements
Section: Chapter Questions
Problem 16QAP: Computers are not supposed to be in very warm rooms. The highest temperature tolerated for maximum...

Related questions

Question
Based on the given data, construct and evaluate the calibration curve by plotting absorbance versus concentration. Calculate the mean concentration of Copper and Chromium in the unknown tap water sample
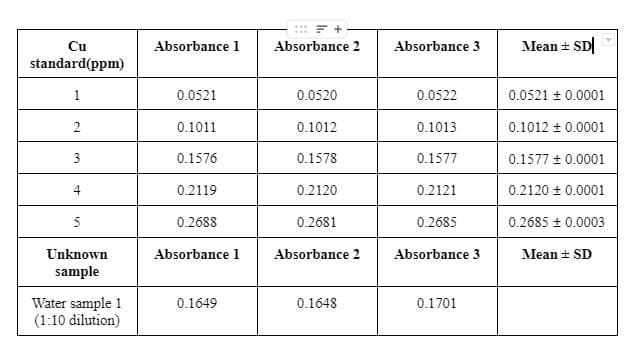
Transcribed Image Text:Cu
Absorbance 1
Absorbance 2
Absorbance 3
Mean + SD|
standard(ppm)
1
0.0521
0.0520
0.0522
0.0521 + 0.0001
2
0.1011
0.1012
0.1013
0.1012 + 0.0001
3
0.1576
0.1578
0.1577
0.1577 + 0.0001
4
0.2119
0.2120
0.2121
0.2120 + 0.0001
5
0.2688
0.2681
0.2685
0.2685 + 0.0003
Unknown
Absorbance 1
Absorbance 2
Absorbance 3
Mean + SD
sample
Water sample 1
(1:10 dilution)
0.1649
0.1648
0.1701
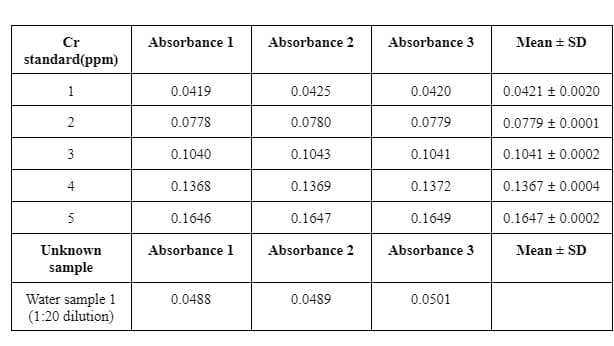
Transcribed Image Text:Cr
Absorbance 1
Absorbance 2
Absorbance 3
Mean + SD
standard(ppm)
1
0.0419
0.0425
0.0420
0.0421 + 0.0020
2
0.0778
0.0780
0.0779
0.0779 + 0.0001
3
0.1040
0.1043
0.1041
0.1041 + 0.0002
4
0.1368
0.1369
0.1372
0.1367 + 0.0004
5
0.1646
0.1647
0.1649
0.1647 + 0.0002
Unknown
Absorbance 1
Absorbance 2
Absorbance 3
Mean + SD
sample
Water sample 1
(1:20 dilution)
0.0488
0.0489
0.0501
Expert Solution
This question has been solved!
Explore an expertly crafted, step-by-step solution for a thorough understanding of key concepts.

Step by step
Solved in 3 steps with 2 images

Knowledge Booster


Learn more about
Need a deep-dive on the concept behind this application? Look no further. Learn more about this topic, chemistry and related others by exploring similar questions and additional content below.Recommended textbooks for you
Chemistry: Principles and Reactions
Chemistry
ISBN:
9781305079373
Author:
William L. Masterton, Cecile N. Hurley
Publisher:
Cengage Learning

Chemistry: Principles and Reactions
Chemistry
ISBN:
9781305079373
Author:
William L. Masterton, Cecile N. Hurley
Publisher:
Cengage Learning