based on the graph, describe the trend in electricity production from wind between 2009 and 2019. 2) describe an environment change that is likely to have occurred in the state of Texas that resulted from the change in Coal production indicated in the graphs between 2009 and 2019. 3) identify and describe one non-renewable energy source that could be used for electricity production in the state of Texas that was not being used in 2009.
based on the graph, describe the trend in electricity production from wind between 2009 and 2019. 2) describe an environment change that is likely to have occurred in the state of Texas that resulted from the change in Coal production indicated in the graphs between 2009 and 2019. 3) identify and describe one non-renewable energy source that could be used for electricity production in the state of Texas that was not being used in 2009.

Managerial Economics: Applications, Strategies and Tactics (MindTap Course List)
14th Edition
ISBN:9781305506381
Author:James R. McGuigan, R. Charles Moyer, Frederick H.deB. Harris
Publisher:James R. McGuigan, R. Charles Moyer, Frederick H.deB. Harris
Chapter11: Price And Output Determination: Monopoly And Dominant Firms
Section: Chapter Questions
Problem 1E

Related questions
Question
1) based on the graph, describe the trend in electricity production from wind between 2009 and 2019.
2) describe an environment change that is likely to have occurred in the state of Texas that resulted from the change in Coal production indicated in the graphs between 2009 and 2019.
3) identify and describe one non-renewable energy source that could be used for electricity production in the state of Texas that was not being used in 2009.
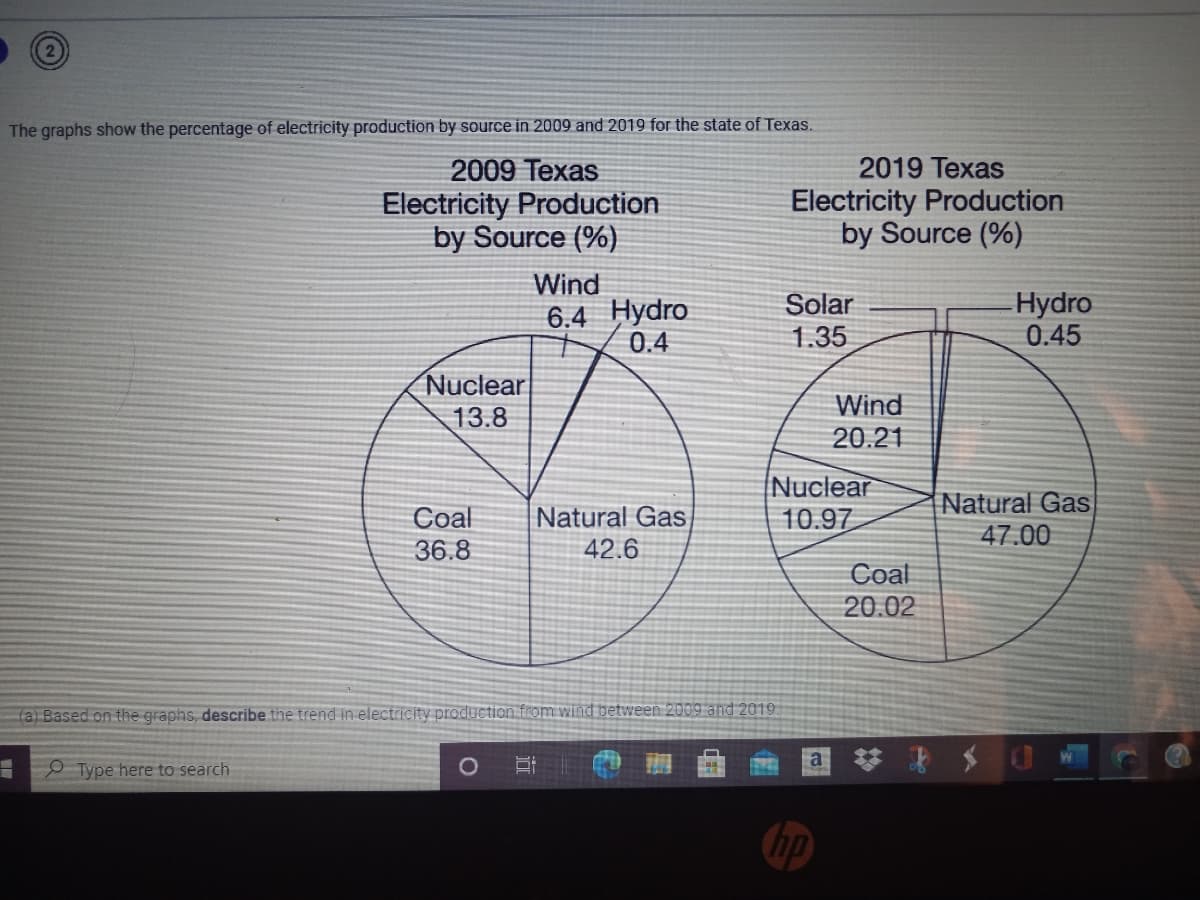
Transcribed Image Text:The graphs show the percentage of electricity production by source in 2009 and 2019 for the state of Texas.
2019 Texas
2009 Texas
Electricity Production
by Source (%)
Electricity Production
by Source (%)
Wind
6.4 Hydro
0.4
Solar
1.35
Hydro
0.45
Nuclear
13.8
Wind
20.21
Coal
36.8
Natural Gas
42.6
Nuclear
10.97
Natural Gas
47.00
Coal
20.02
(a) Based on the graphs, describe the trend in electricity production from wind between 2009 and 2019.
O Type here to search
回苓 メ0
Chp
Expert Solution
This question has been solved!
Explore an expertly crafted, step-by-step solution for a thorough understanding of key concepts.

This is a popular solution!

Trending now
This is a popular solution!

Step by step
Solved in 2 steps with 2 images

Knowledge Booster


Learn more about
Need a deep-dive on the concept behind this application? Look no further. Learn more about this topic, economics and related others by exploring similar questions and additional content below.Recommended textbooks for you
Managerial Economics: Applications, Strategies an…
Economics
ISBN:
9781305506381
Author:
James R. McGuigan, R. Charles Moyer, Frederick H.deB. Harris
Publisher:
Cengage Learning
Managerial Economics: Applications, Strategies an…
Economics
ISBN:
9781305506381
Author:
James R. McGuigan, R. Charles Moyer, Frederick H.deB. Harris
Publisher:
Cengage Learning