Based on the tables and graphs below, interpret and report the results. You need to identify the test, discuss the assumptions, follow the decision map steps for interpretation, and then report the results in an academic style. Model 1 Variables Entered/Removed Variables Entered Model 1 Distance in kms from nearest competitor Variables. Removed a. Dependent Variable: Value of monthly sales in $k in 2007 b. All requested variables entered. Sum of Squares 68133866.85 Method Enter 48606508.07 116740374.9 ANOVA df 1 12 13 Model 1 Regression Residual Total a. Dependent Variable: Value of monthly sales in $k in 2007 b. Predictors: (Constant), Distance in kms from nearest competitor Mean Square 68133866.85 4050542.340 R 764 Model Summary F 16.821 R Square 584 549 a. Predictors: (Constant), Distance in kms from nearest competitor b. Dependent Variable: Value of monthly sales in Skin 2007 Sig. Adjusted R Square .001 Std. Error of the Estimate 2012.59592
Based on the tables and graphs below, interpret and report the results. You need to identify the test, discuss the assumptions, follow the decision map steps for interpretation, and then report the results in an academic style. Model 1 Variables Entered/Removed Variables Entered Model 1 Distance in kms from nearest competitor Variables. Removed a. Dependent Variable: Value of monthly sales in $k in 2007 b. All requested variables entered. Sum of Squares 68133866.85 Method Enter 48606508.07 116740374.9 ANOVA df 1 12 13 Model 1 Regression Residual Total a. Dependent Variable: Value of monthly sales in $k in 2007 b. Predictors: (Constant), Distance in kms from nearest competitor Mean Square 68133866.85 4050542.340 R 764 Model Summary F 16.821 R Square 584 549 a. Predictors: (Constant), Distance in kms from nearest competitor b. Dependent Variable: Value of monthly sales in Skin 2007 Sig. Adjusted R Square .001 Std. Error of the Estimate 2012.59592

Glencoe Algebra 1, Student Edition, 9780079039897, 0079039898, 2018
18th Edition
ISBN:9780079039897
Author:Carter
Publisher:Carter
Chapter4: Equations Of Linear Functions
Section: Chapter Questions
Problem 4SGR

Related questions
Question
Please please how to write if based on the following
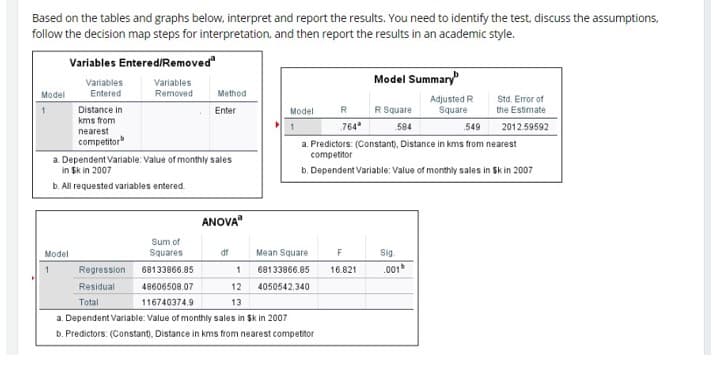
Transcribed Image Text:Based on the tables and graphs below, interpret and report the results. You need to identify the test, discuss the assumptions,
follow the decision map steps for interpretation, and then report the results in an academic style.
Model
1
Variables Entered/Removed
Variables
Entered
Model
1
Distance in
kms from
nearest
competitor
Variables.
Removed
a. Dependent Variable: Value of monthly sales
in $k in 2007
b. All requested variables entered.
Regression
Residual
Sum of
Squares
68133866.85
Method
Enter
48606508.07
116740374.9
ANOVA
df
Model
1
1
12
Total
13
a. Dependent Variable: Value of monthly sales in $k in 2007
b. Predictors: (Constant), Distance in kms from nearest competitor
Mean Square
68133866.85
4050542.340
R
.764
Model Summary
F
16.821
R Square
584
549
a. Predictors: (Constant), Distance in kms from nearest
competitor
b. Dependent Variable: Value of monthly sales in Skin 2007
Sig.
Adjusted R
Square
.001
Std. Error of
the Estimate
2012.59592
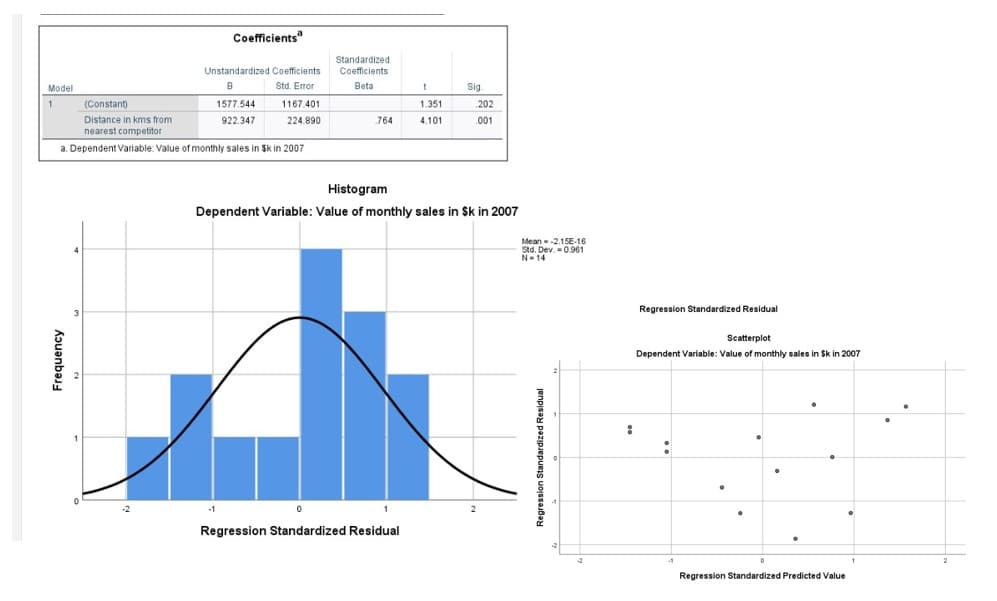
Transcribed Image Text:Model
1
Coefficients"
Frequency
Unstandardized Coefficients
B
Std. Error
(Constant)
Distance in kms from
nearest competitor
a. Dependent Variable: Value of monthly sales in $k in 2007
1577.544
922.347
1167.401
224.890
Standardized
Coefficients
Beta
.764
t
1.351
4.101
0
Regression Standardized Residual
Sig.
202
001
Histogram
Dependent Variable: Value of monthly sales in $k in 2007
Mean-2.15E-16
Std. Dev.-0.961
N-14
Regression Standardized Residual
:
Regression Standardized Residual
Scatterplot
Dependent Variable: Value of monthly sales in $k in 2007
:
Regression Standardized Predicted Value
Expert Solution
This question has been solved!
Explore an expertly crafted, step-by-step solution for a thorough understanding of key concepts.

Step by step
Solved in 3 steps

Recommended textbooks for you
Glencoe Algebra 1, Student Edition, 9780079039897…
Algebra
ISBN:
9780079039897
Author:
Carter
Publisher:
McGraw Hill

Algebra & Trigonometry with Analytic Geometry
Algebra
ISBN:
9781133382119
Author:
Swokowski
Publisher:
Cengage

Big Ideas Math A Bridge To Success Algebra 1: Stu…
Algebra
ISBN:
9781680331141
Author:
HOUGHTON MIFFLIN HARCOURT
Publisher:
Houghton Mifflin Harcourt
Glencoe Algebra 1, Student Edition, 9780079039897…
Algebra
ISBN:
9780079039897
Author:
Carter
Publisher:
McGraw Hill
Algebra & Trigonometry with Analytic Geometry
Algebra
ISBN:
9781133382119
Author:
Swokowski
Publisher:
Cengage
Big Ideas Math A Bridge To Success Algebra 1: Stu…
Algebra
ISBN:
9781680331141
Author:
HOUGHTON MIFFLIN HARCOURT
Publisher:
Houghton Mifflin Harcourt

Algebra and Trigonometry (MindTap Course List)
Algebra
ISBN:
9781305071742
Author:
James Stewart, Lothar Redlin, Saleem Watson
Publisher:
Cengage Learning

College Algebra
Algebra
ISBN:
9781305115545
Author:
James Stewart, Lothar Redlin, Saleem Watson
Publisher:
Cengage Learning

Holt Mcdougal Larson Pre-algebra: Student Edition…
Algebra
ISBN:
9780547587776
Author:
HOLT MCDOUGAL
Publisher:
HOLT MCDOUGAL