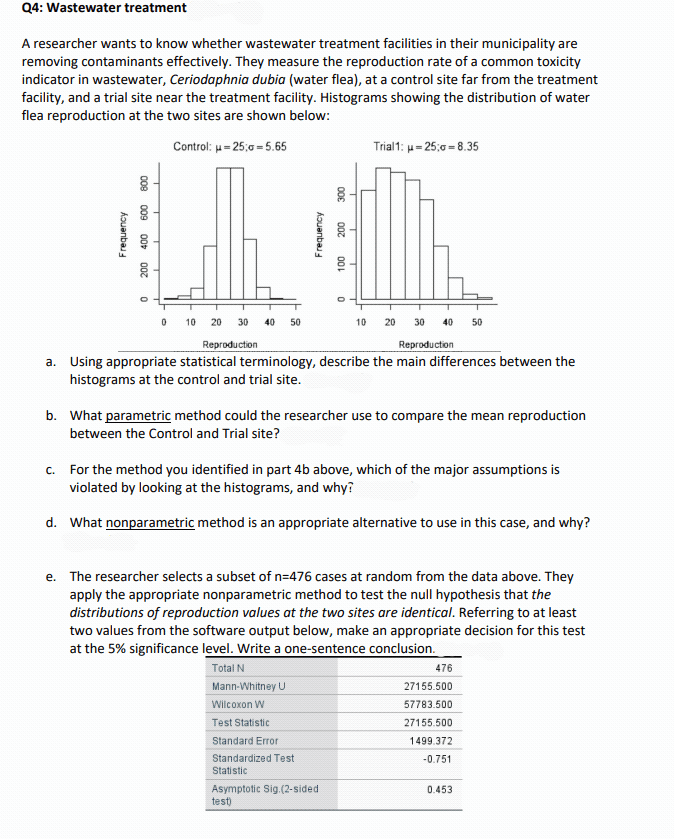
A researcher wants to know whether wastewater treatment facilities in their municipality are removing contaminants effectively. They measure the reproduction rate of a common toxicity indicator in wastewater, Ceriodaphnia dubia (water flea), at a control site far from the treatment facility, and a trial site near the treatment facility. Histograms showing the distribution of water flea reproduction at the two sites are shown below: Control: μ-25;0=5.65 800 600 Frequency 400 200 0 0 10 20 30 50 Aquanbau 300 200 100 0 10 20 30 40 50 Reproduction Reproduction a. Using appropriate statistical terminology, describe the main differences between the histograms at the control and trial site. Trial1: μ-25;0=8.35 b. What parametric method could the researcher use to compare the mean reproduction between the Control and Trial site? c. For the method you identified in part 4b above, which of the major assumptions is violated by looking at the histograms, and why? d. What nonparametric method is an appropriate alternative to use in this case, and why? e. The researcher selects a subset of n=476 cases at random from the data above. They apply the appropriate nonparametric method to test the null hypothesis that the distributions of reproduction values at the two sites are identical. Referring to at least two values from the software output below, make an appropriate decision for this test at the 5% significance level. Write a one-sentence conclusion. Total N Mann-Whitney U Wilcoxon W Test Statistic Standard Error Standardized Test Statistic Asymptotic Sig.(2-sided test) 476 27155.500 57783.500 27155.500 1499.372 -0.751 0.453
A researcher wants to know whether wastewater treatment facilities in their municipality are removing contaminants effectively. They measure the reproduction rate of a common toxicity indicator in wastewater, Ceriodaphnia dubia (water flea), at a control site far from the treatment facility, and a trial site near the treatment facility. Histograms showing the distribution of water flea reproduction at the two sites are shown below: Control: μ-25;0=5.65 800 600 Frequency 400 200 0 0 10 20 30 50 Aquanbau 300 200 100 0 10 20 30 40 50 Reproduction Reproduction a. Using appropriate statistical terminology, describe the main differences between the histograms at the control and trial site. Trial1: μ-25;0=8.35 b. What parametric method could the researcher use to compare the mean reproduction between the Control and Trial site? c. For the method you identified in part 4b above, which of the major assumptions is violated by looking at the histograms, and why? d. What nonparametric method is an appropriate alternative to use in this case, and why? e. The researcher selects a subset of n=476 cases at random from the data above. They apply the appropriate nonparametric method to test the null hypothesis that the distributions of reproduction values at the two sites are identical. Referring to at least two values from the software output below, make an appropriate decision for this test at the 5% significance level. Write a one-sentence conclusion. Total N Mann-Whitney U Wilcoxon W Test Statistic Standard Error Standardized Test Statistic Asymptotic Sig.(2-sided test) 476 27155.500 57783.500 27155.500 1499.372 -0.751 0.453

Glencoe Algebra 1, Student Edition, 9780079039897, 0079039898, 2018
18th Edition
ISBN:9780079039897
Author:Carter
Publisher:Carter
Chapter10: Statistics
Section10.1: Measures Of Center
Problem 9PPS

Related questions
Question
Transcribed Image Text:Q4: Wastewater treatment
A researcher wants to know whether wastewater treatment facilities in their municipality are
removing contaminants effectively. They measure the reproduction rate of a common toxicity
indicator in wastewater, Ceriodaphnia dubia (water flea), at a control site far from the treatment
facility, and a trial site near the treatment facility. Histograms showing the distribution of water
flea reproduction at the two sites are shown below:
Control: μ-25;0=5.65
Frequency
800
009
400
noz
0
0
10 20 30 40 50
300
Frequency
200
T
0
T
100
L
10 20 30 40 50
Reproduction
Reproduction
a. Using appropriate statistical terminology, describe the main differences between the
histograms at the control and trial site.
Standard Error
Standardized Test
Statistic
Asymptotic Sig.(2-sided
test)
Trial1: μ-25;0=8.35
b. What parametric method could the researcher use to compare the mean reproduction
between the Control and Trial site?
c. For the method you identified in part 4b above, which of the major assumptions is
violated by looking at the histograms, and why?
d. What nonparametric method is an appropriate alternative to use in this case, and why?
e. The researcher selects a subset of n=476 cases at random from the data above. They
apply the appropriate nonparametric method to test the null hypothesis that the
distributions of reproduction values at the two sites are identical. Referring to at least
two values from the software output below, make an appropriate decision for this test
at the 5% significance level. Write a one-sentence conclusion.
Total N
Mann-Whitney U
Wilcoxon W
Test Statistic
476
27155.500
57783.500
27155.500
1499.372
-0.751
0.453
Expert Solution
This question has been solved!
Explore an expertly crafted, step-by-step solution for a thorough understanding of key concepts.

Step by step
Solved in 4 steps

Recommended textbooks for you
Glencoe Algebra 1, Student Edition, 9780079039897…
Algebra
ISBN:
9780079039897
Author:
Carter
Publisher:
McGraw Hill
Glencoe Algebra 1, Student Edition, 9780079039897…
Algebra
ISBN:
9780079039897
Author:
Carter
Publisher:
McGraw Hill